
Elasticsearch8.16.6 安装使用Filebeat进行日志分析
安装地址:https://www.elastic.co/docs/reference/beats/filebeat/filebeat-installation-configuration
Elasticsearch8.16.x 安装Filebeat配置
curl -L -O https://artifacts.elastic.co/downloads/beats/filebeat/filebeat-8.16.6-linux-x86_64.tar.gztar xzvf filebeat-8.16.6-linux-x86_64.tar.gz后台运行命令
nohup ./filebeat -e -c filebeat.yml > filebeat.log 2>&1 &使用Filebeat将程序生成的log文件上传到Elasticsearch,在Kibana中进行日志的分析和收集。
filebeat.yml input上传日志相关配置,读取指定目录下的所有日志文件, input配置官网地址:https://www.elastic.co/docs/reference/beats/filebeat/filebeat-installation-configuration 在右上角找到指定的版本即可
filebeat.inputs:
- type: filestream  id: erp-bakend-id  # fasle不自动上报,true进行自动上报  enabled: true  paths:    # 可以配置多个路径    - /home/attom-12/app/log/erp/*.log  # 日志标签,方便在kibana中进行过滤检索  tags: ["erp-bakend-log"]  # 匹配规则  parsers:    - multiline:        type: pattern        # 匹配日志以【日期开头        pattern: '^\[[0-9]{4}'        negate: true        match: after
匹配如下开头的日志文件内容
[2026-01-18 18:44:52.308] INFO 16556 --- [io-8888-exec-49] .a.d.u.s.a.JwtAuthenticationBeforeFilterfilebeat输出部分我这边使用的直接是elasticsearch,配置信息如下:
 output.elasticsearch:  # es服务地址  hosts: ["https://192.168.6.14:9200"]
  # Performance preset - one of "balanced", "throughput", "scale",  # "latency", or "custom".  preset: custom
  # elastic账号密码  username: "elastic"  password: "xxxxxxx"  # 配置ssl连接  ssl:    enabled: true    ca_trusted_fingerprint: "94258f44xxxx3ba47b56a6e7451eddc7617d1c870b4690a"    verification_mode: "none"  # 关键配置
如上配置后,暂时不要启动filebeat,还需要进行如下的相关配置。
在Kibana中的Stack Management -> Index Templates进行配置
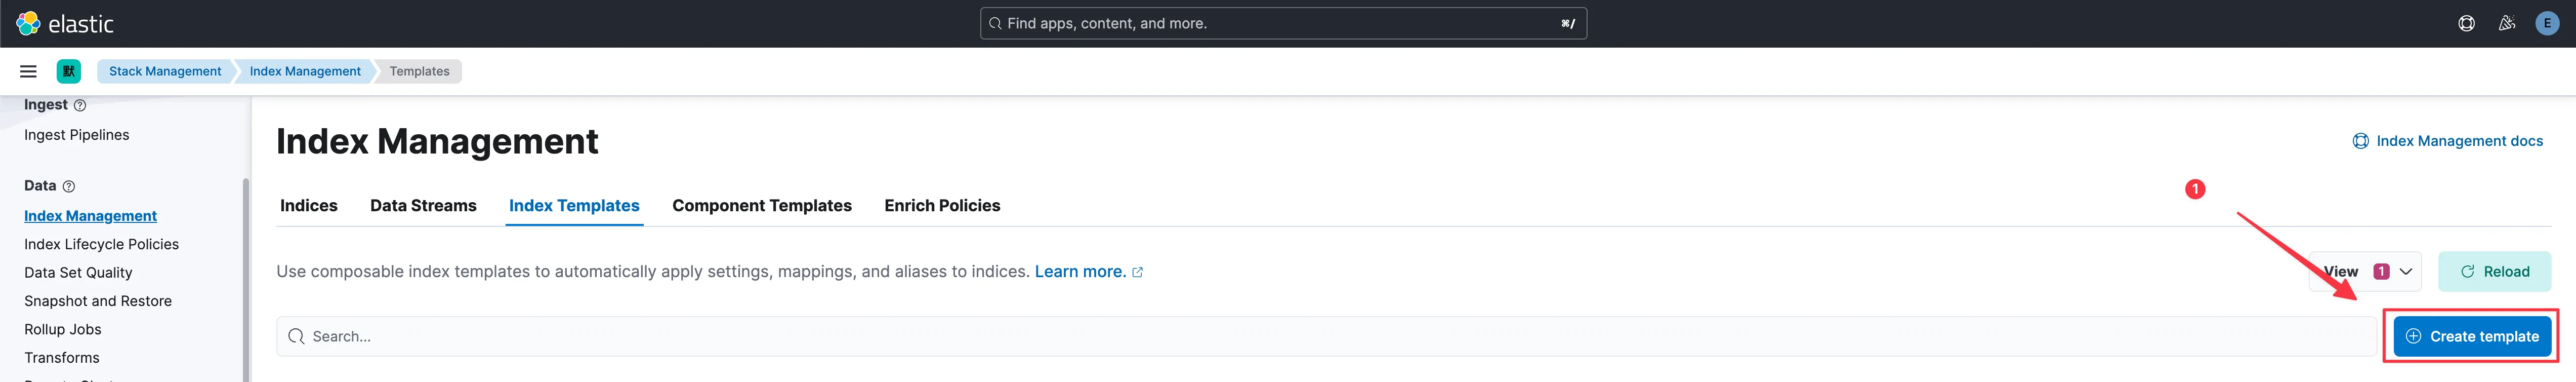
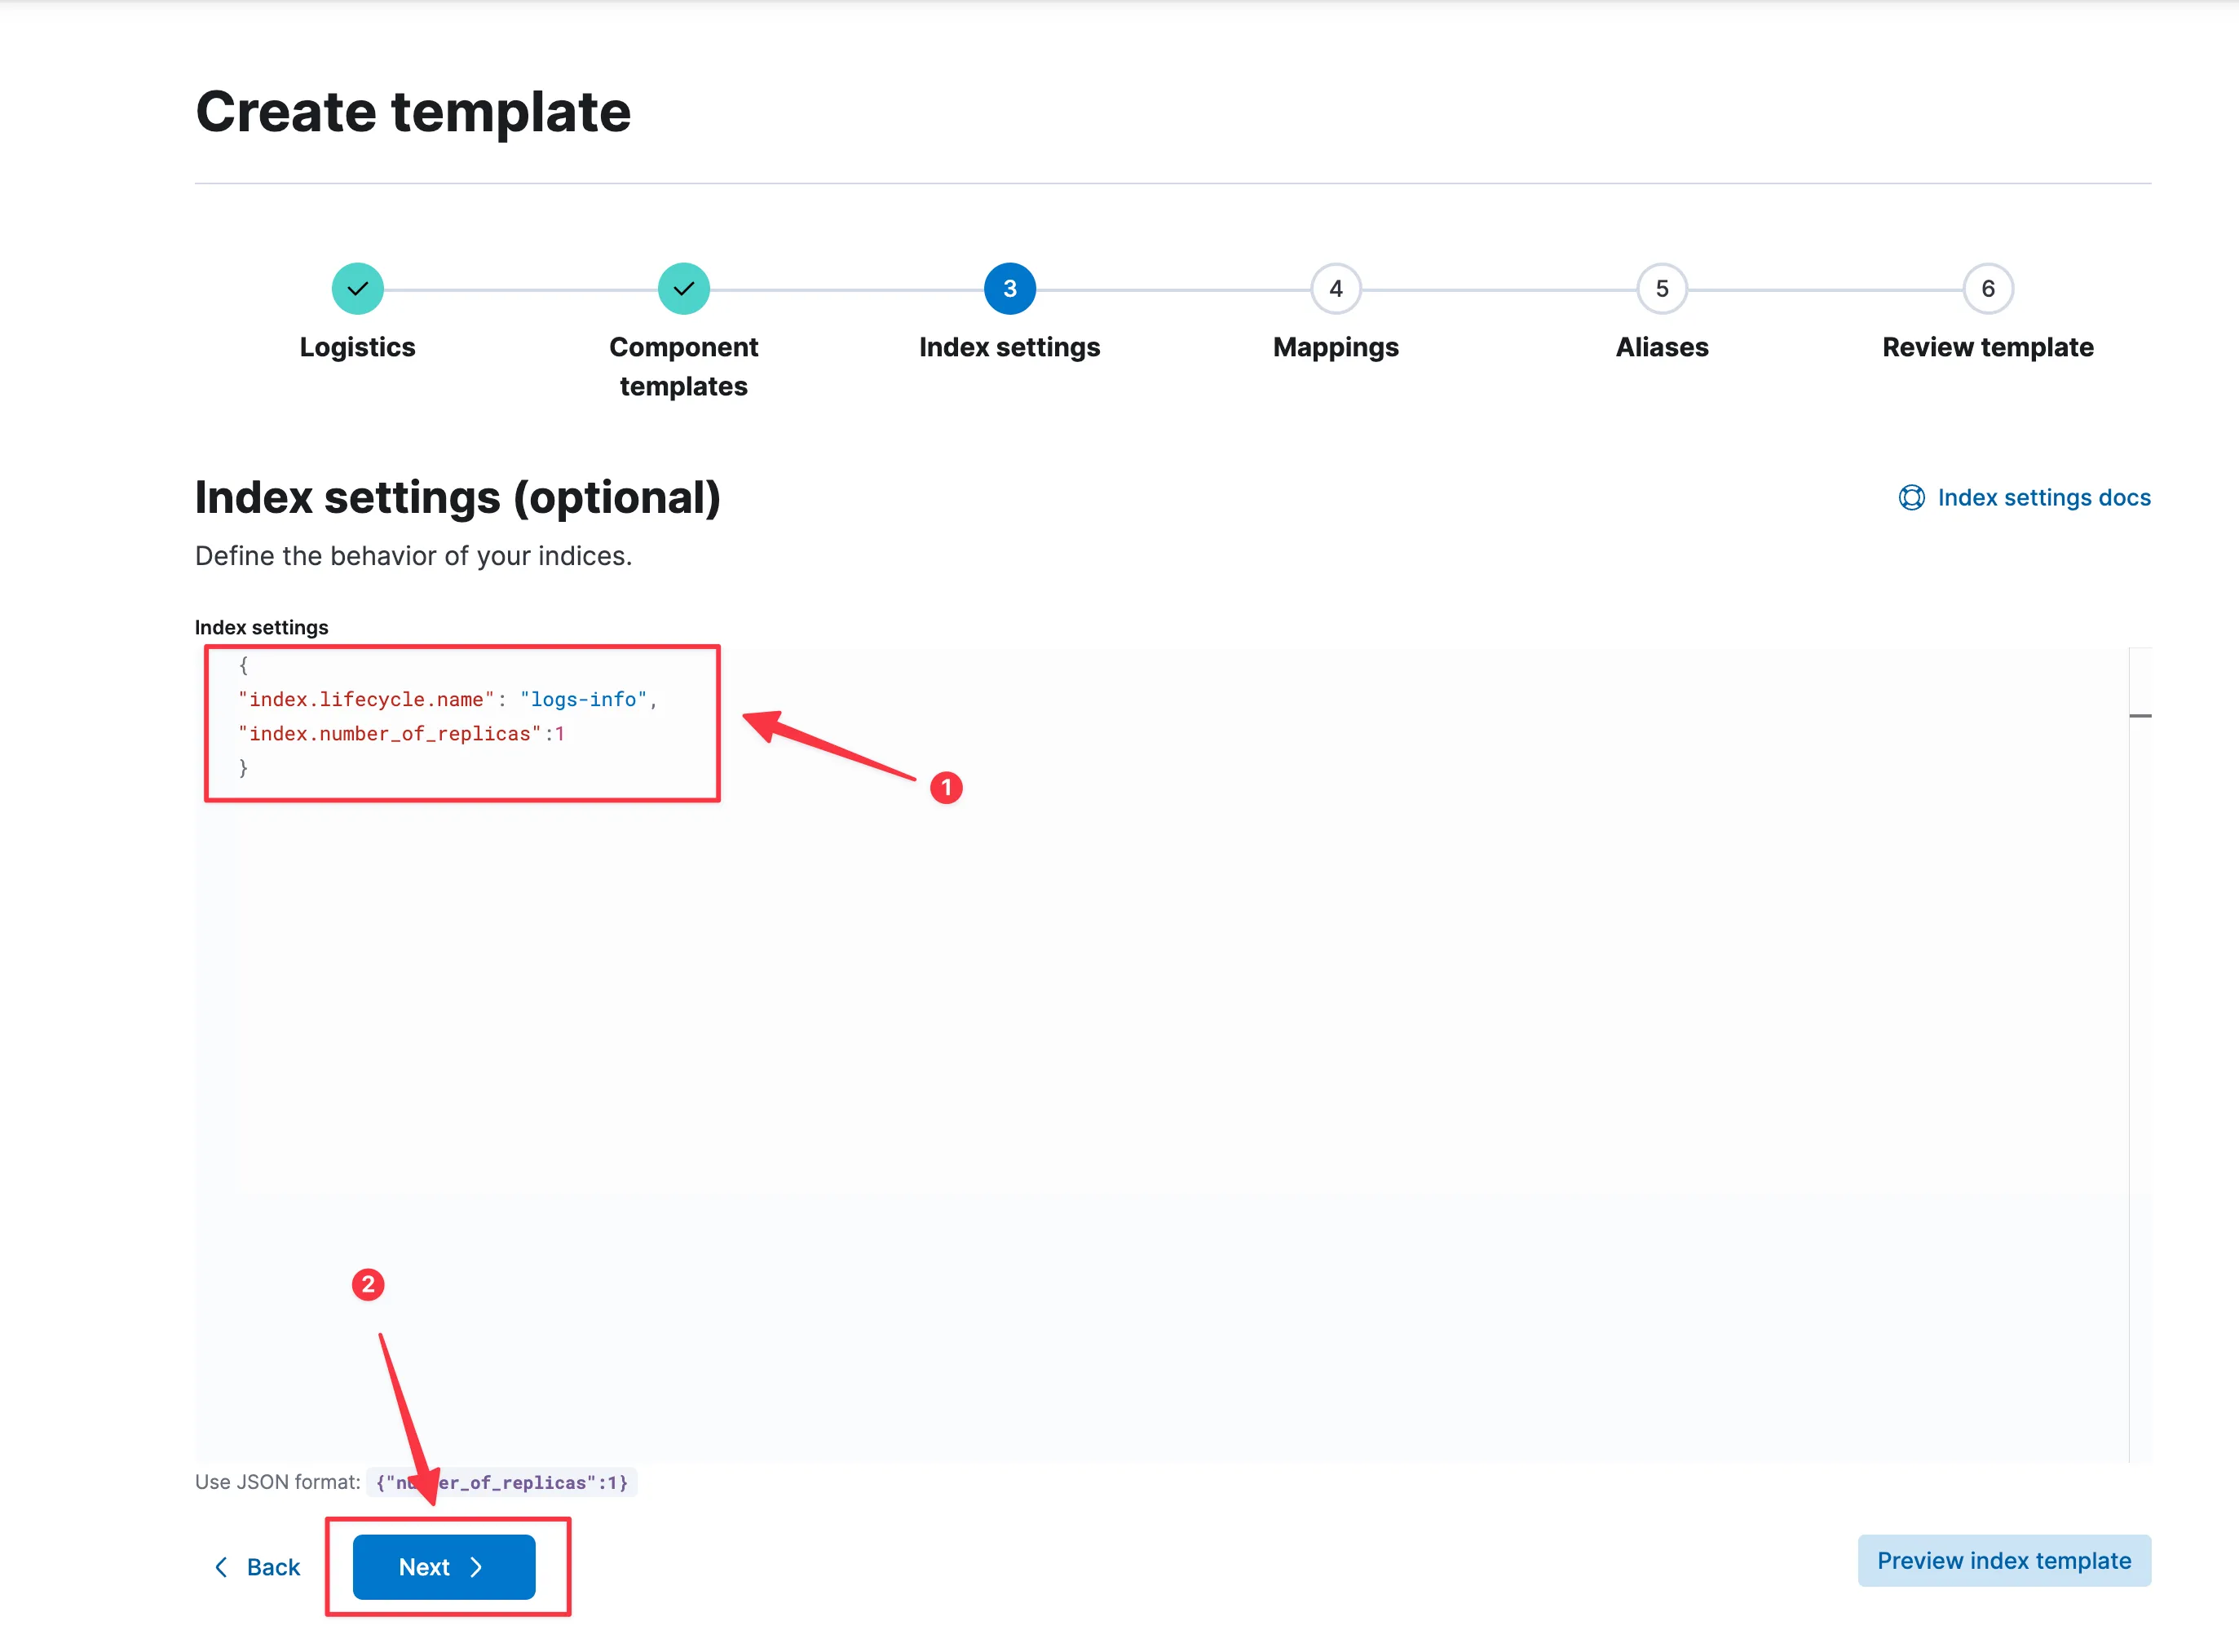
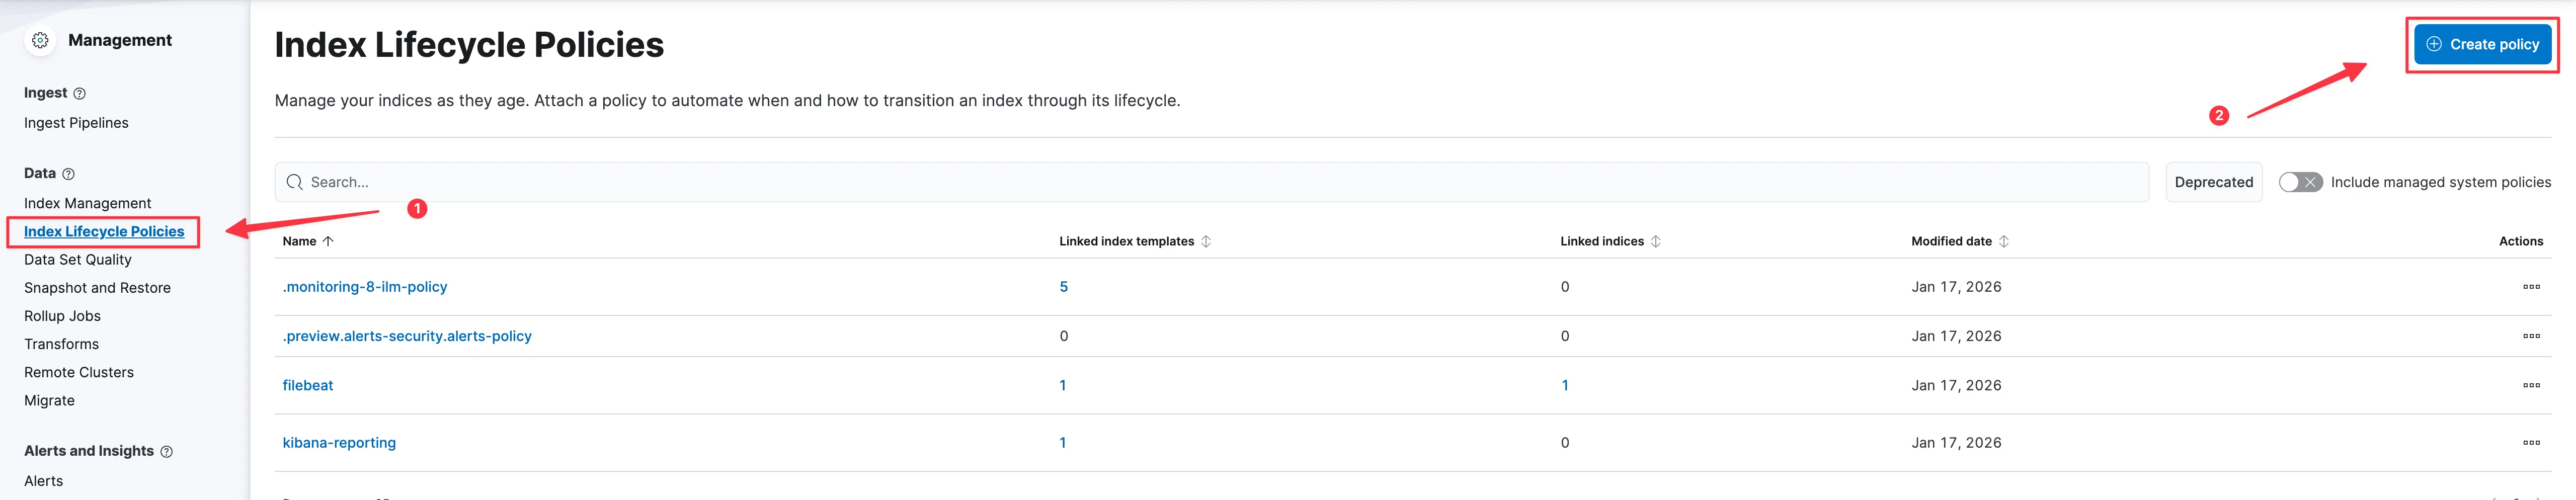
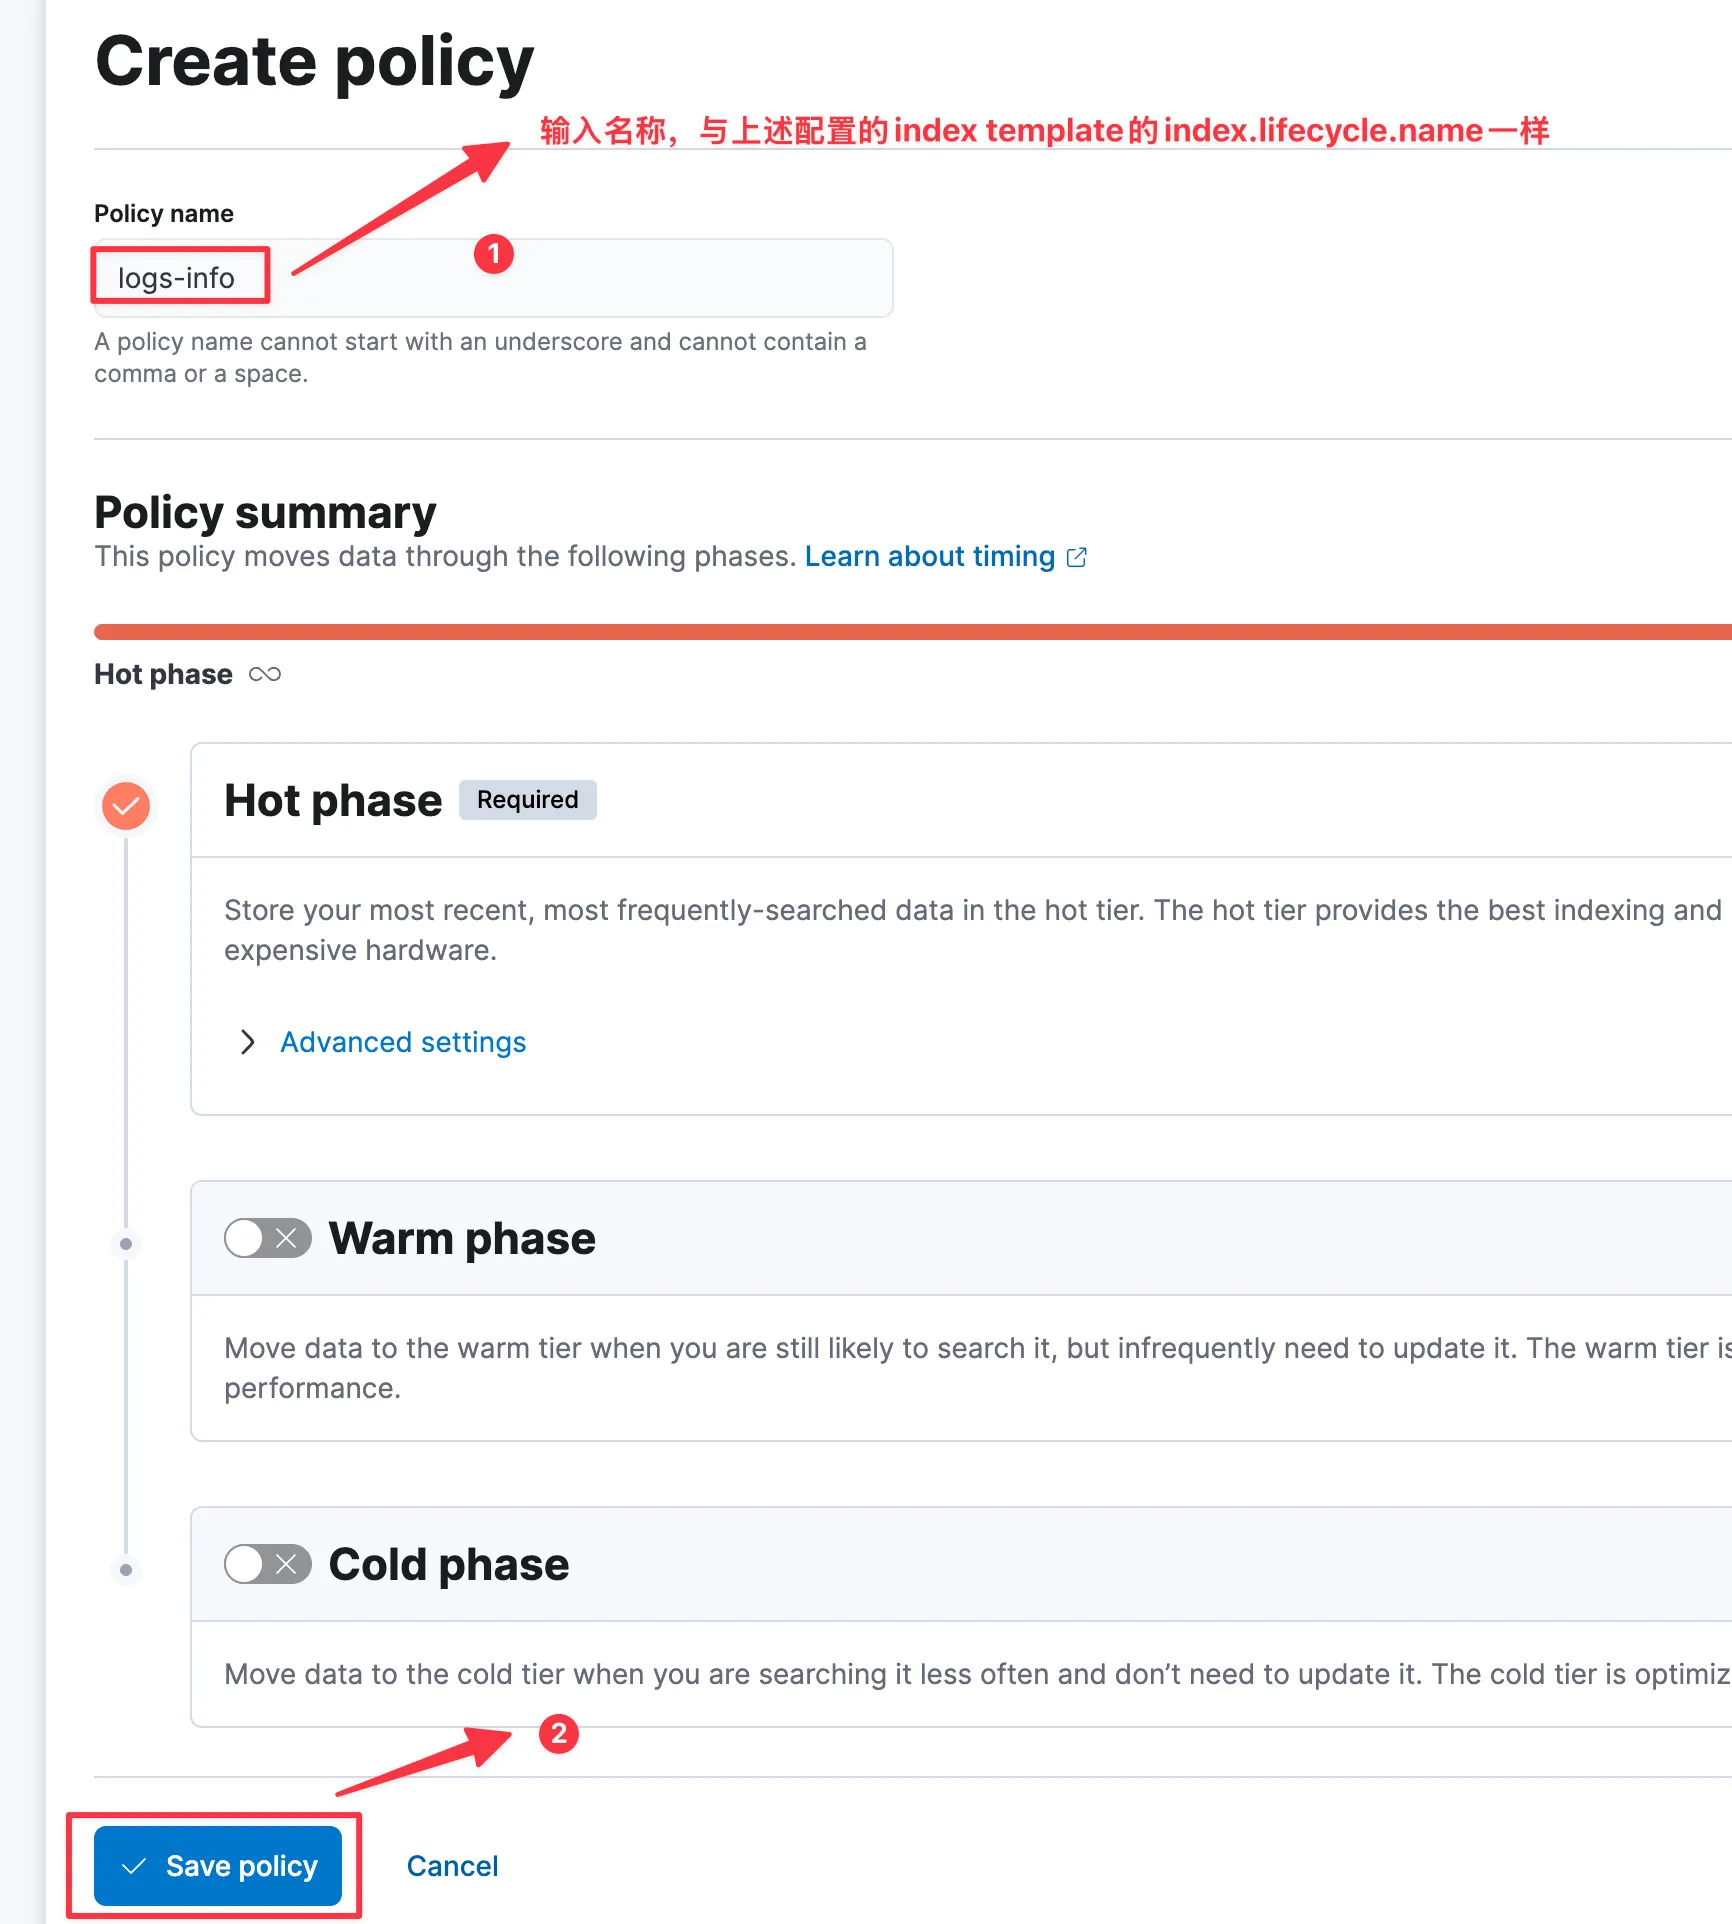
注意填入的index.lifecycle.name名称需要与后续创建的Index Lifecycle Policies一致
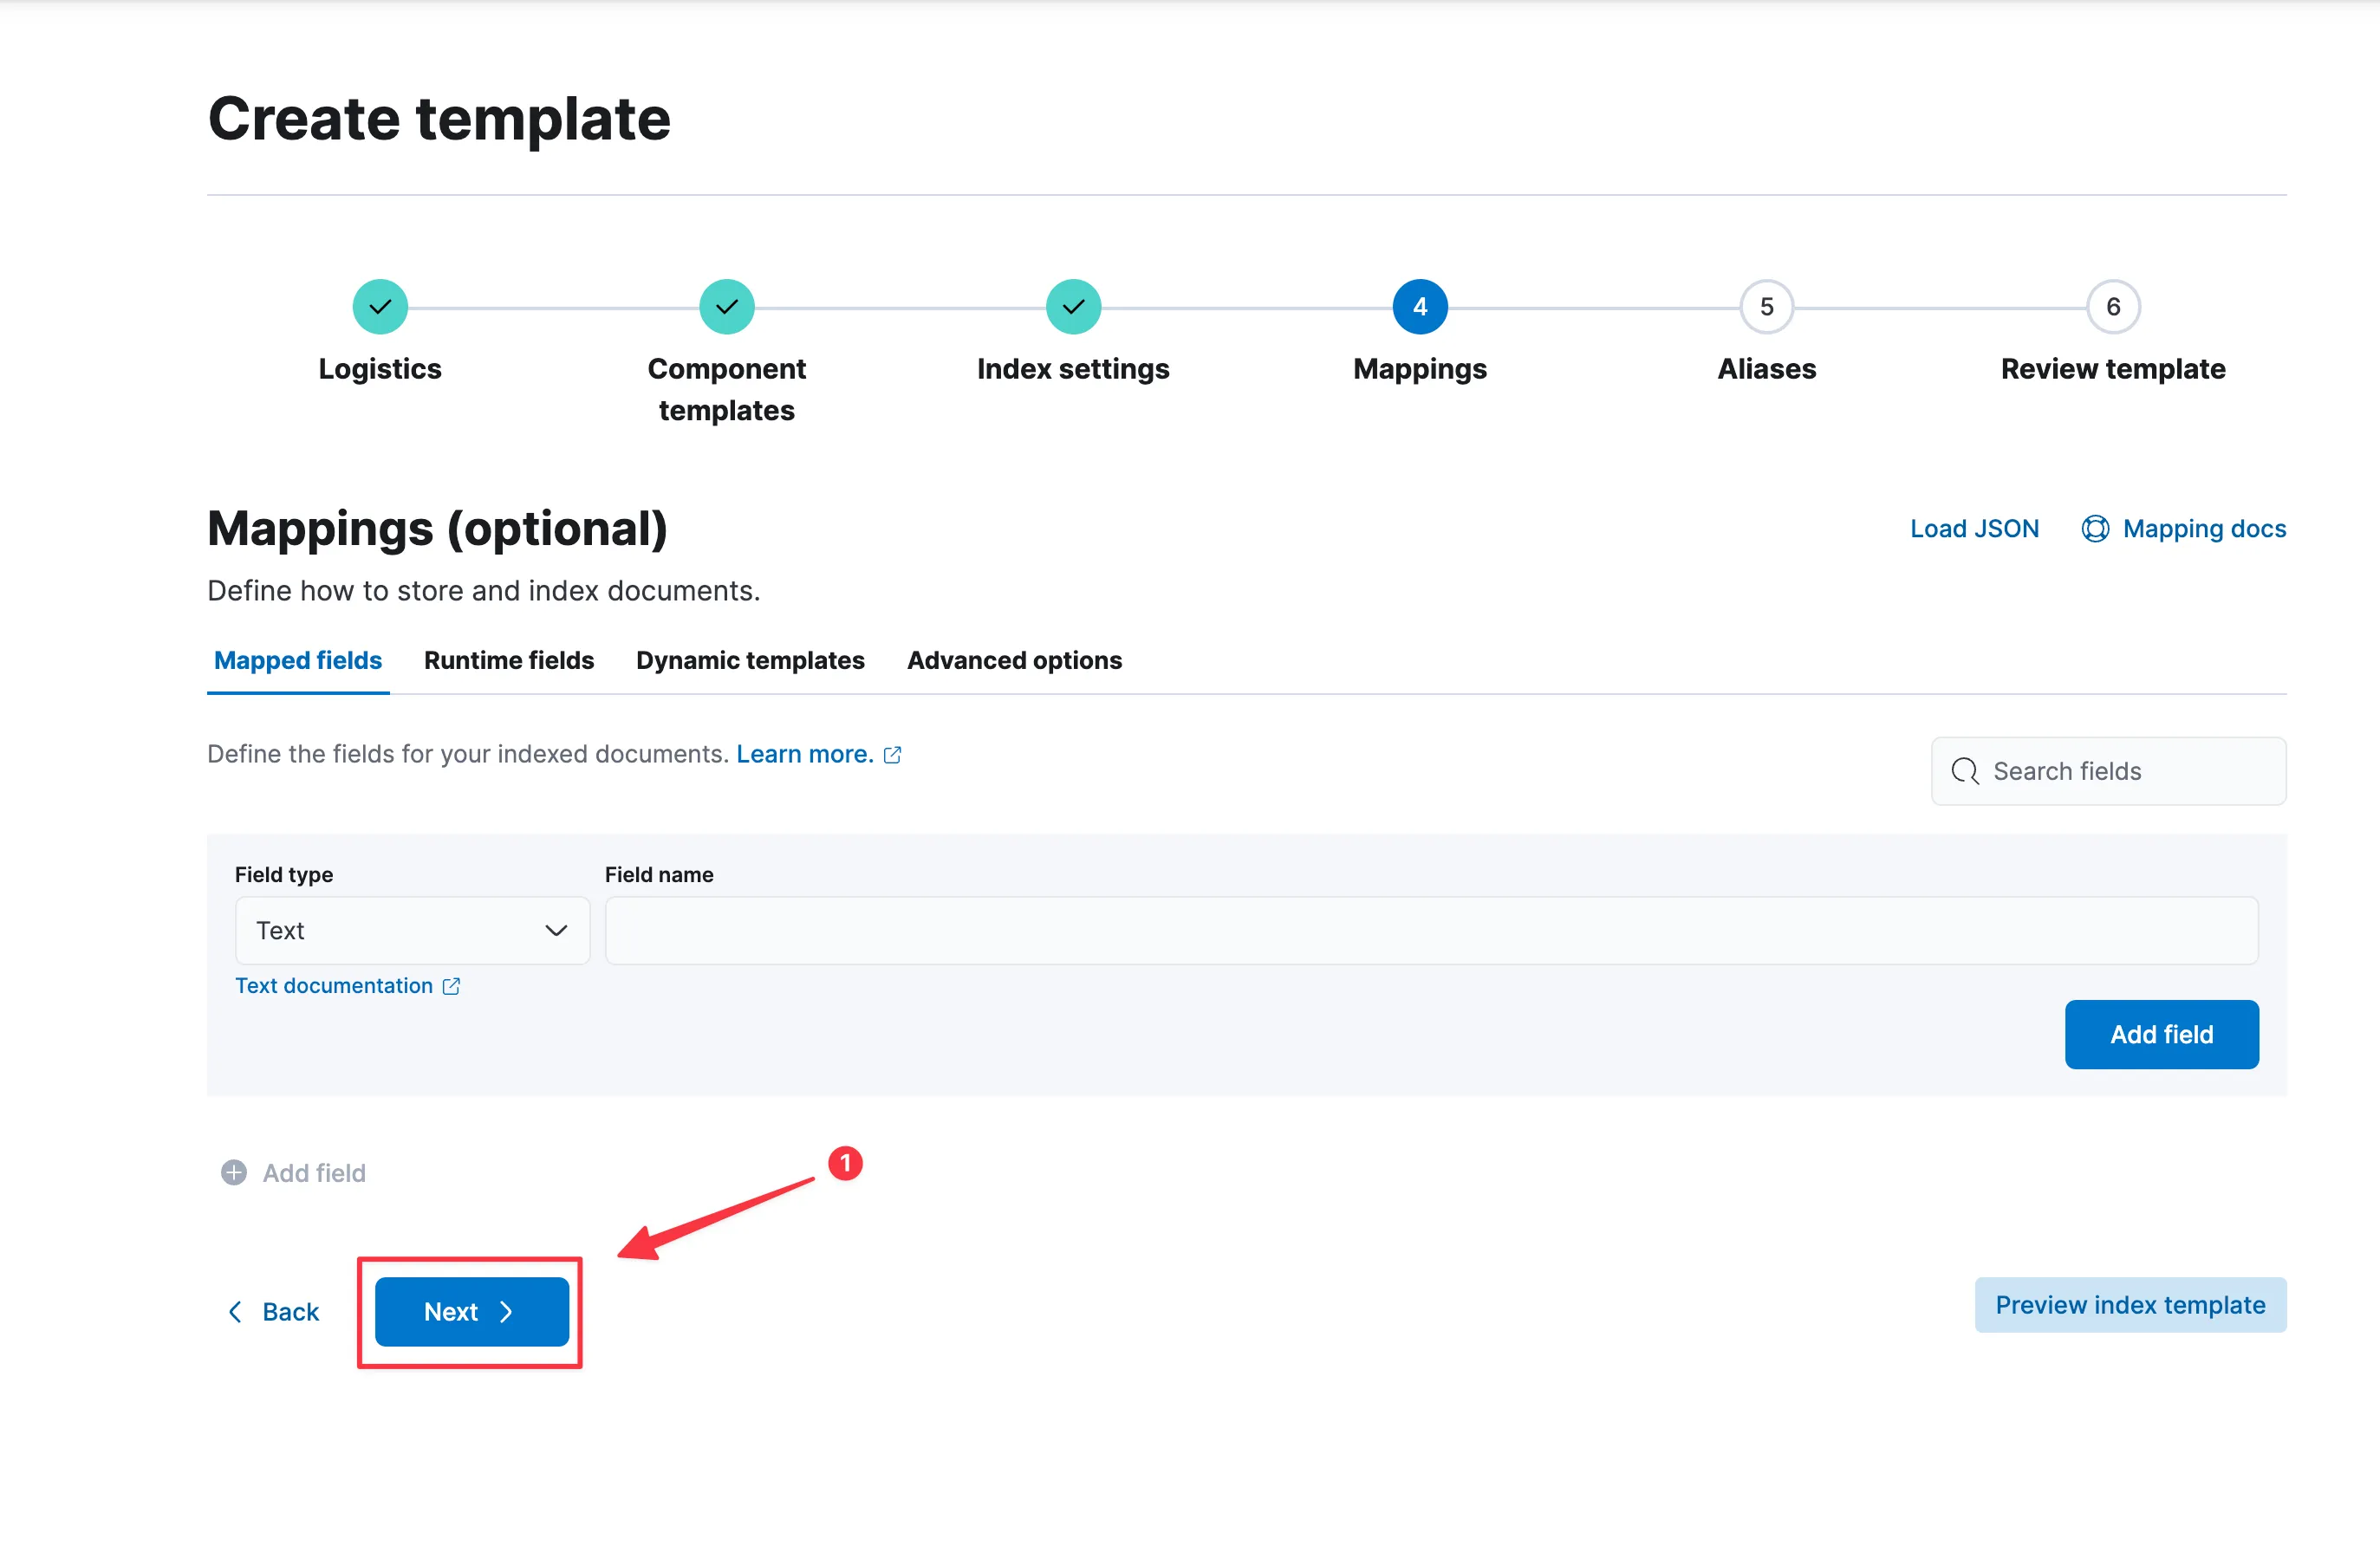
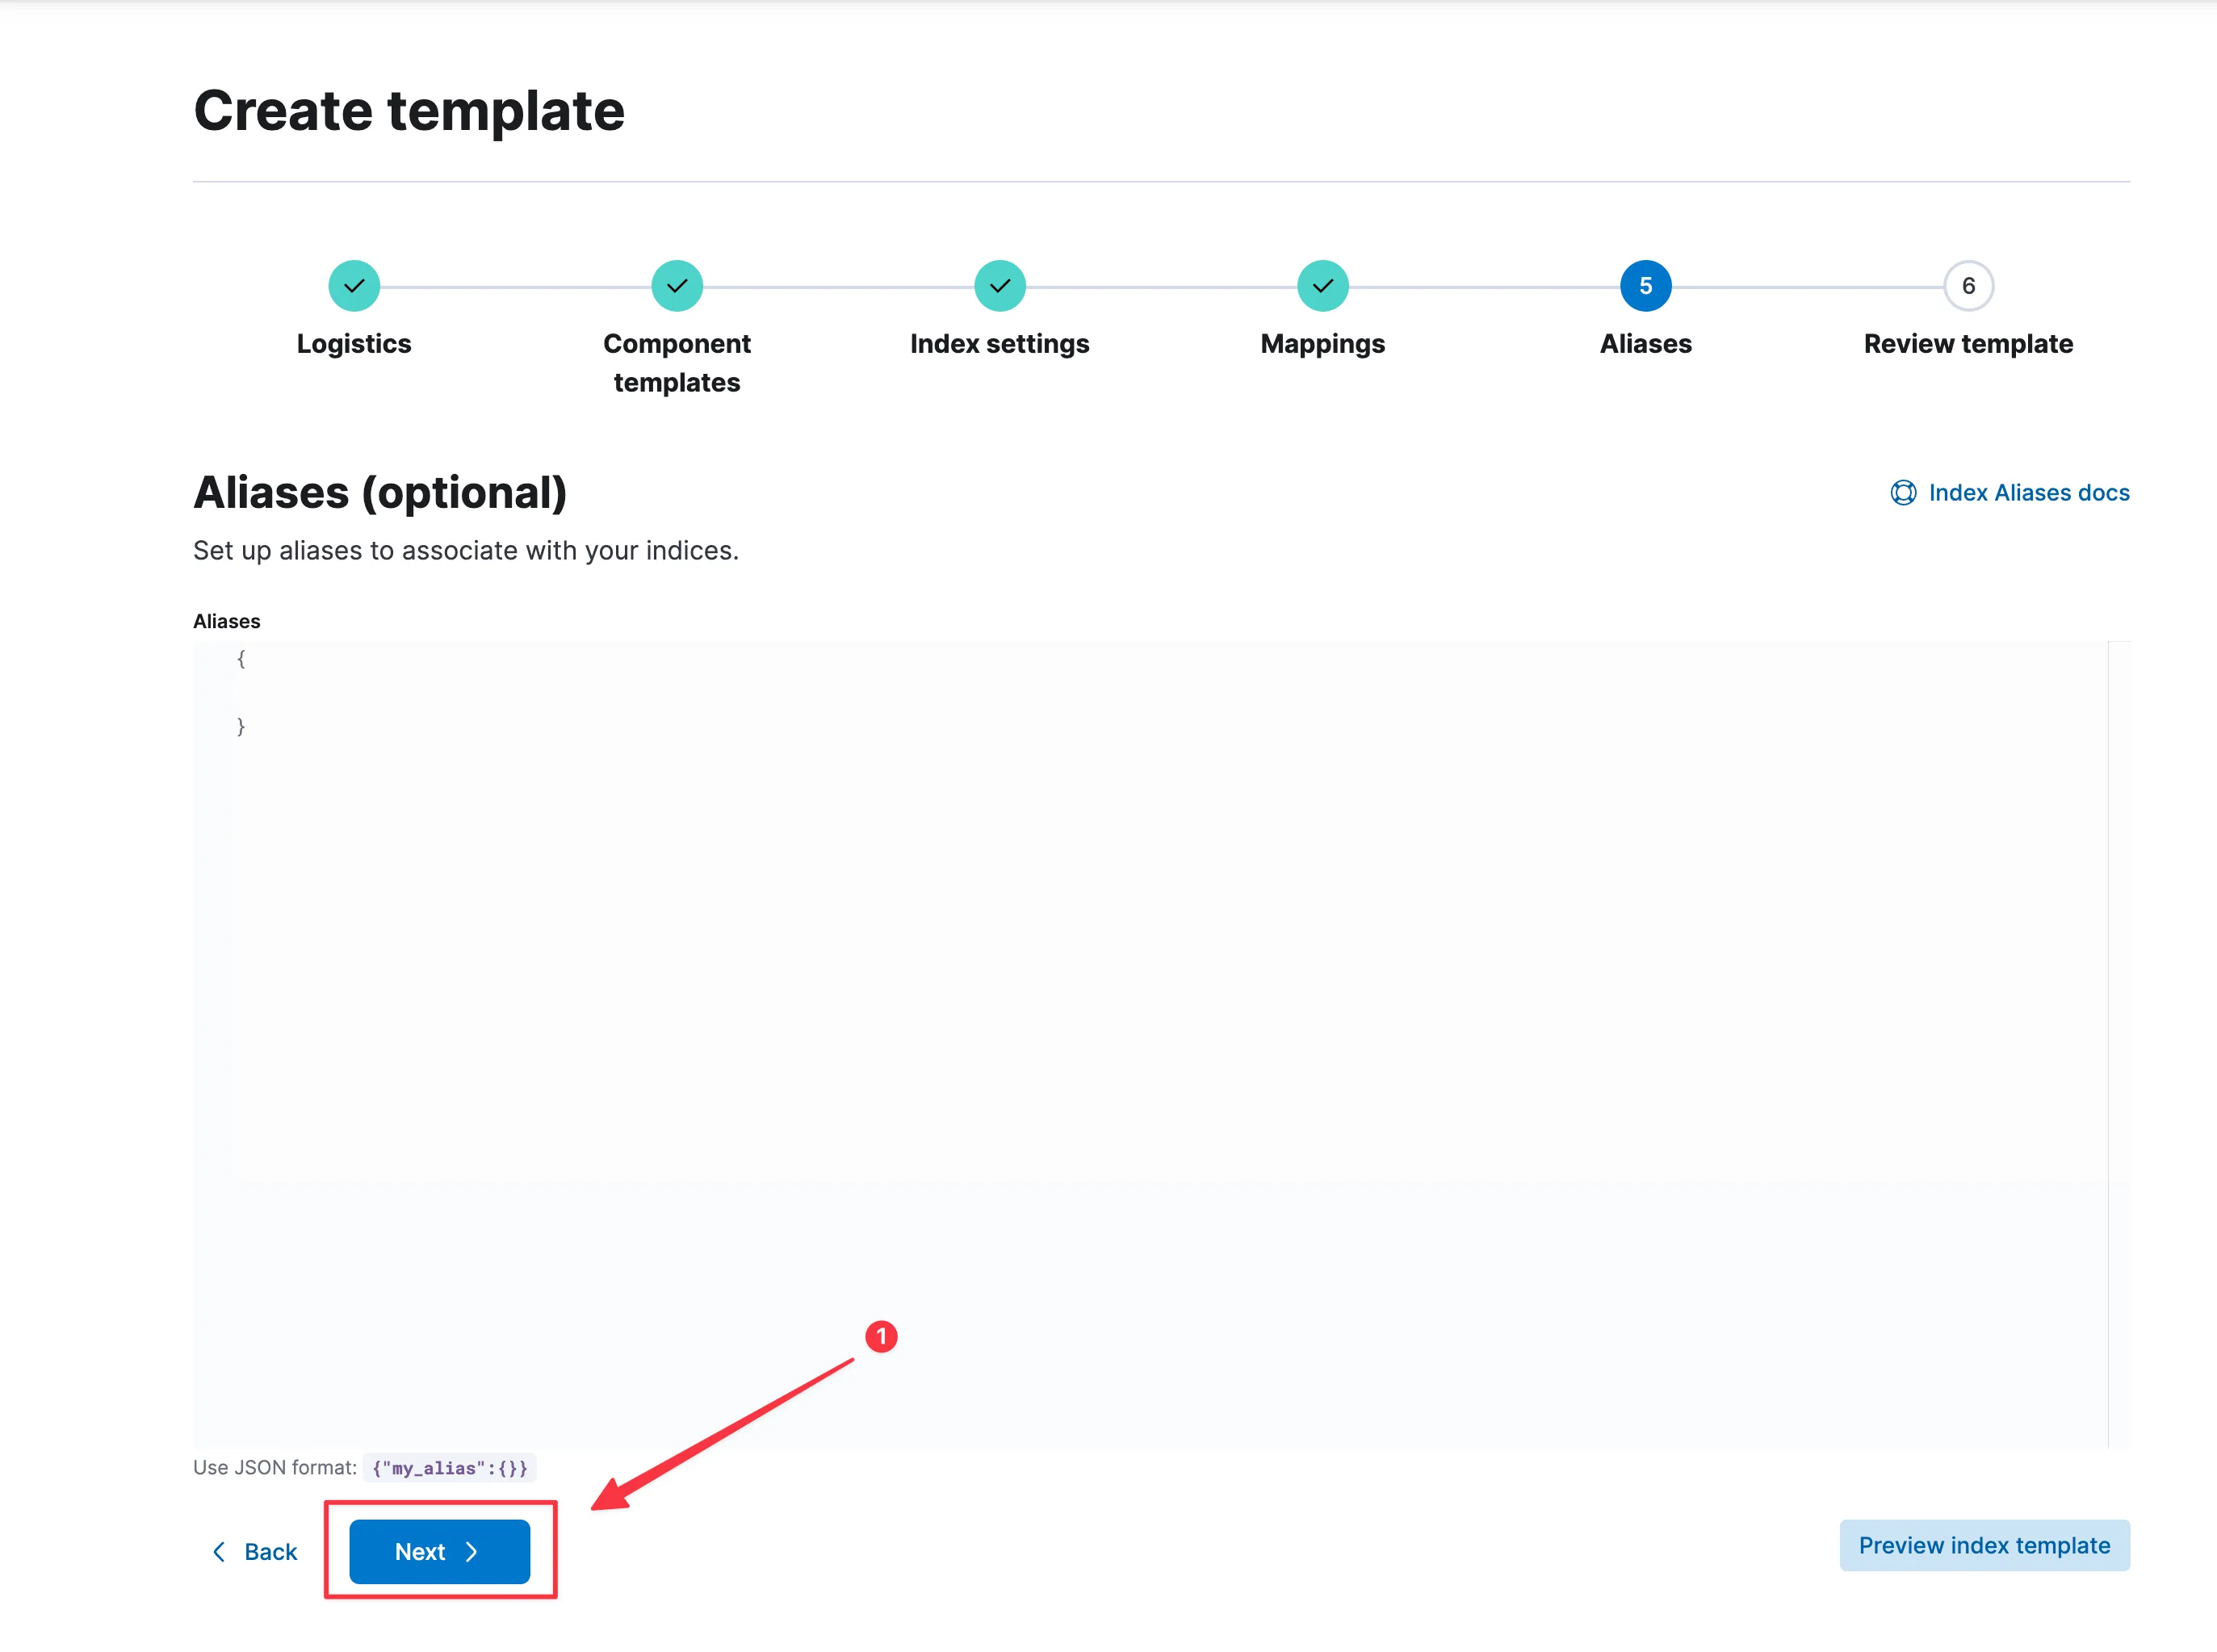
在Kibana中的Stack Management -> Index Templates进行配置
过会,就可以看见Index Management 中的Data Streams中会有我们上述配置的logs-info数据流。
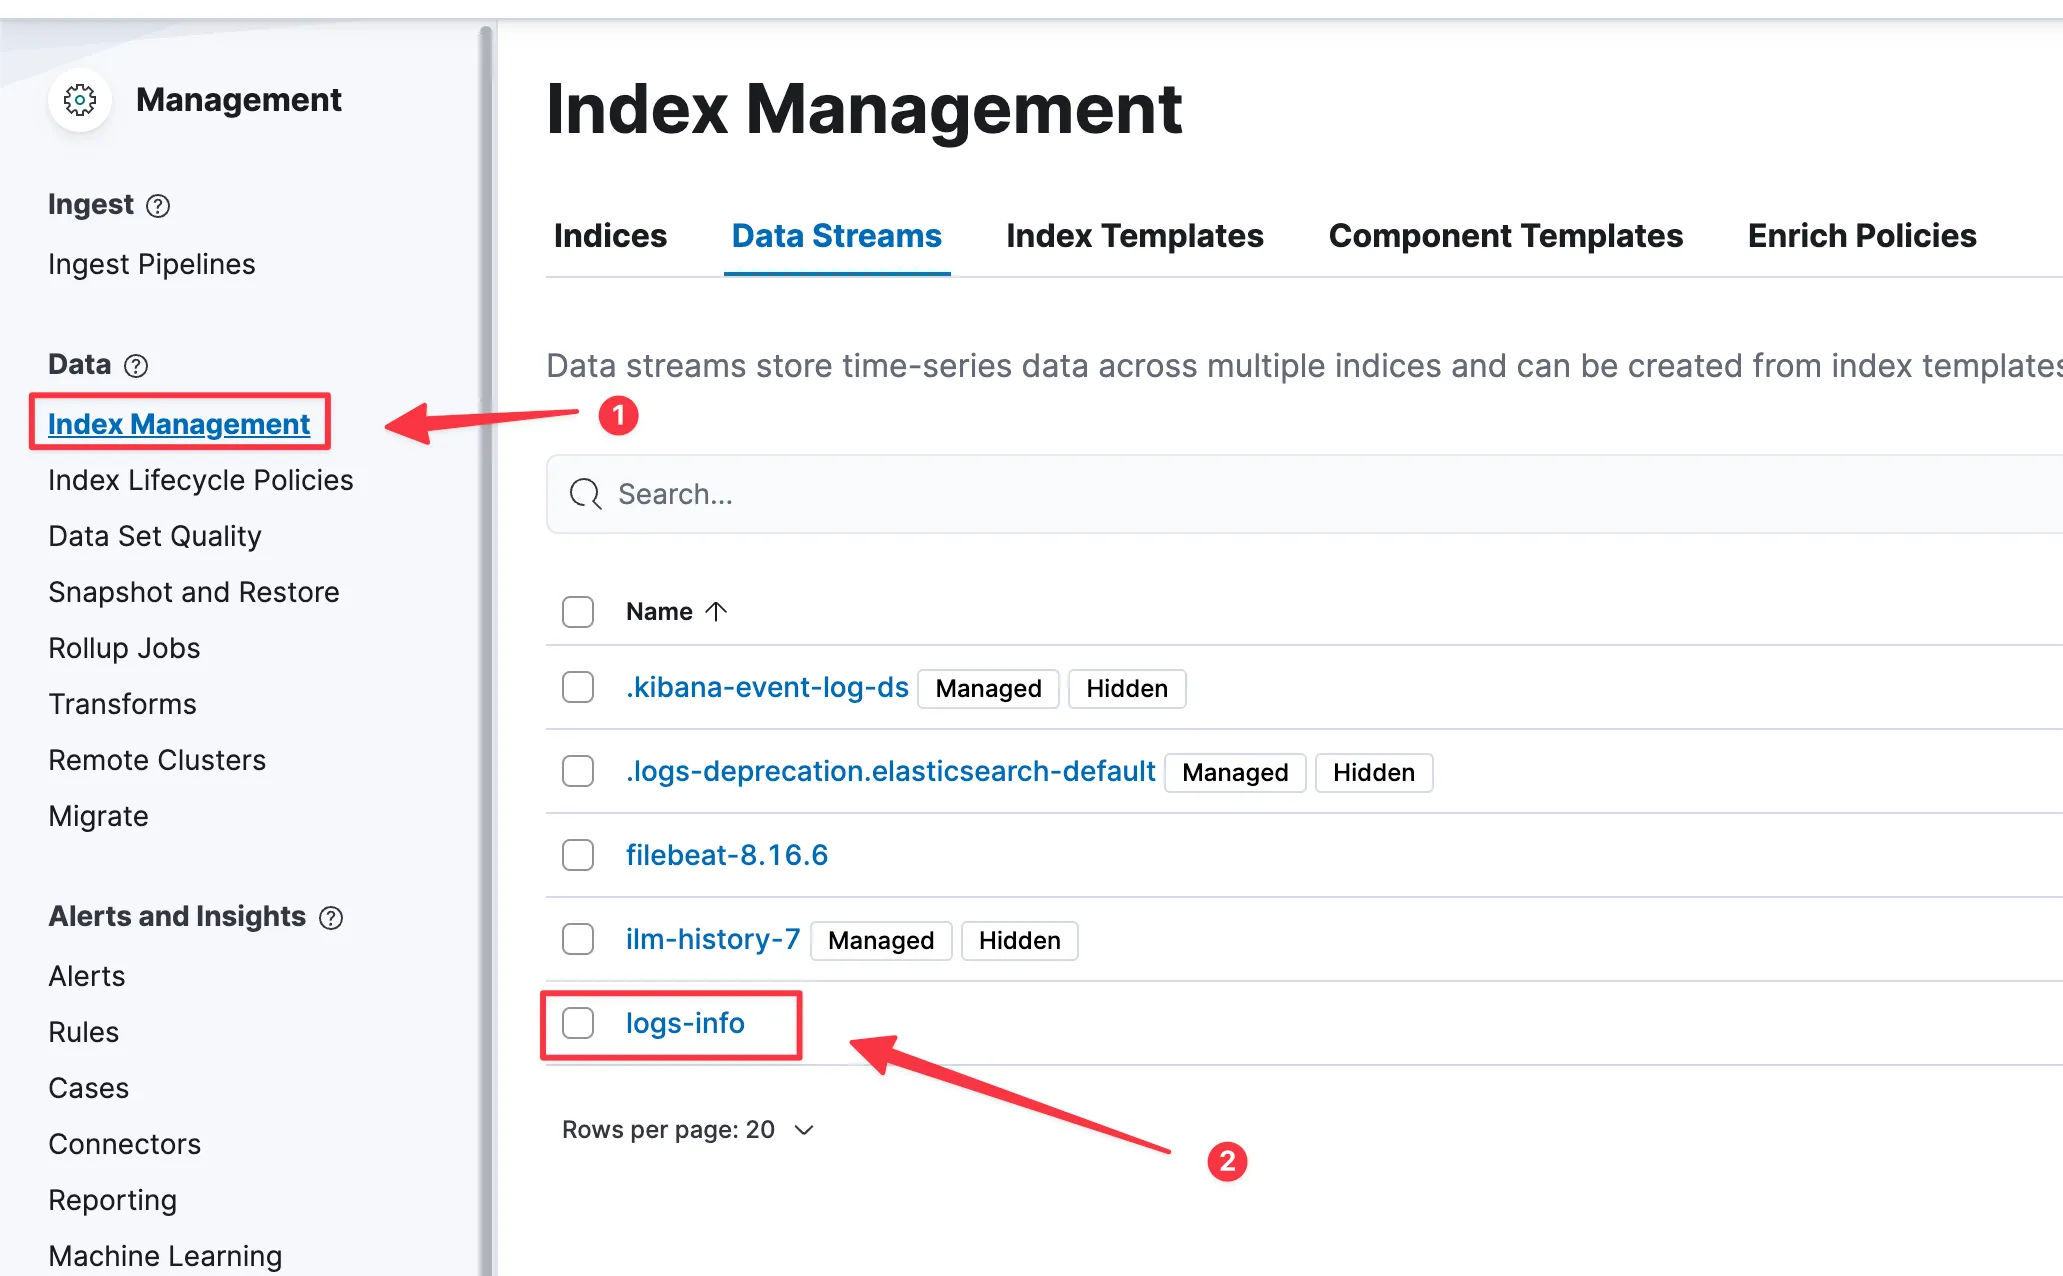
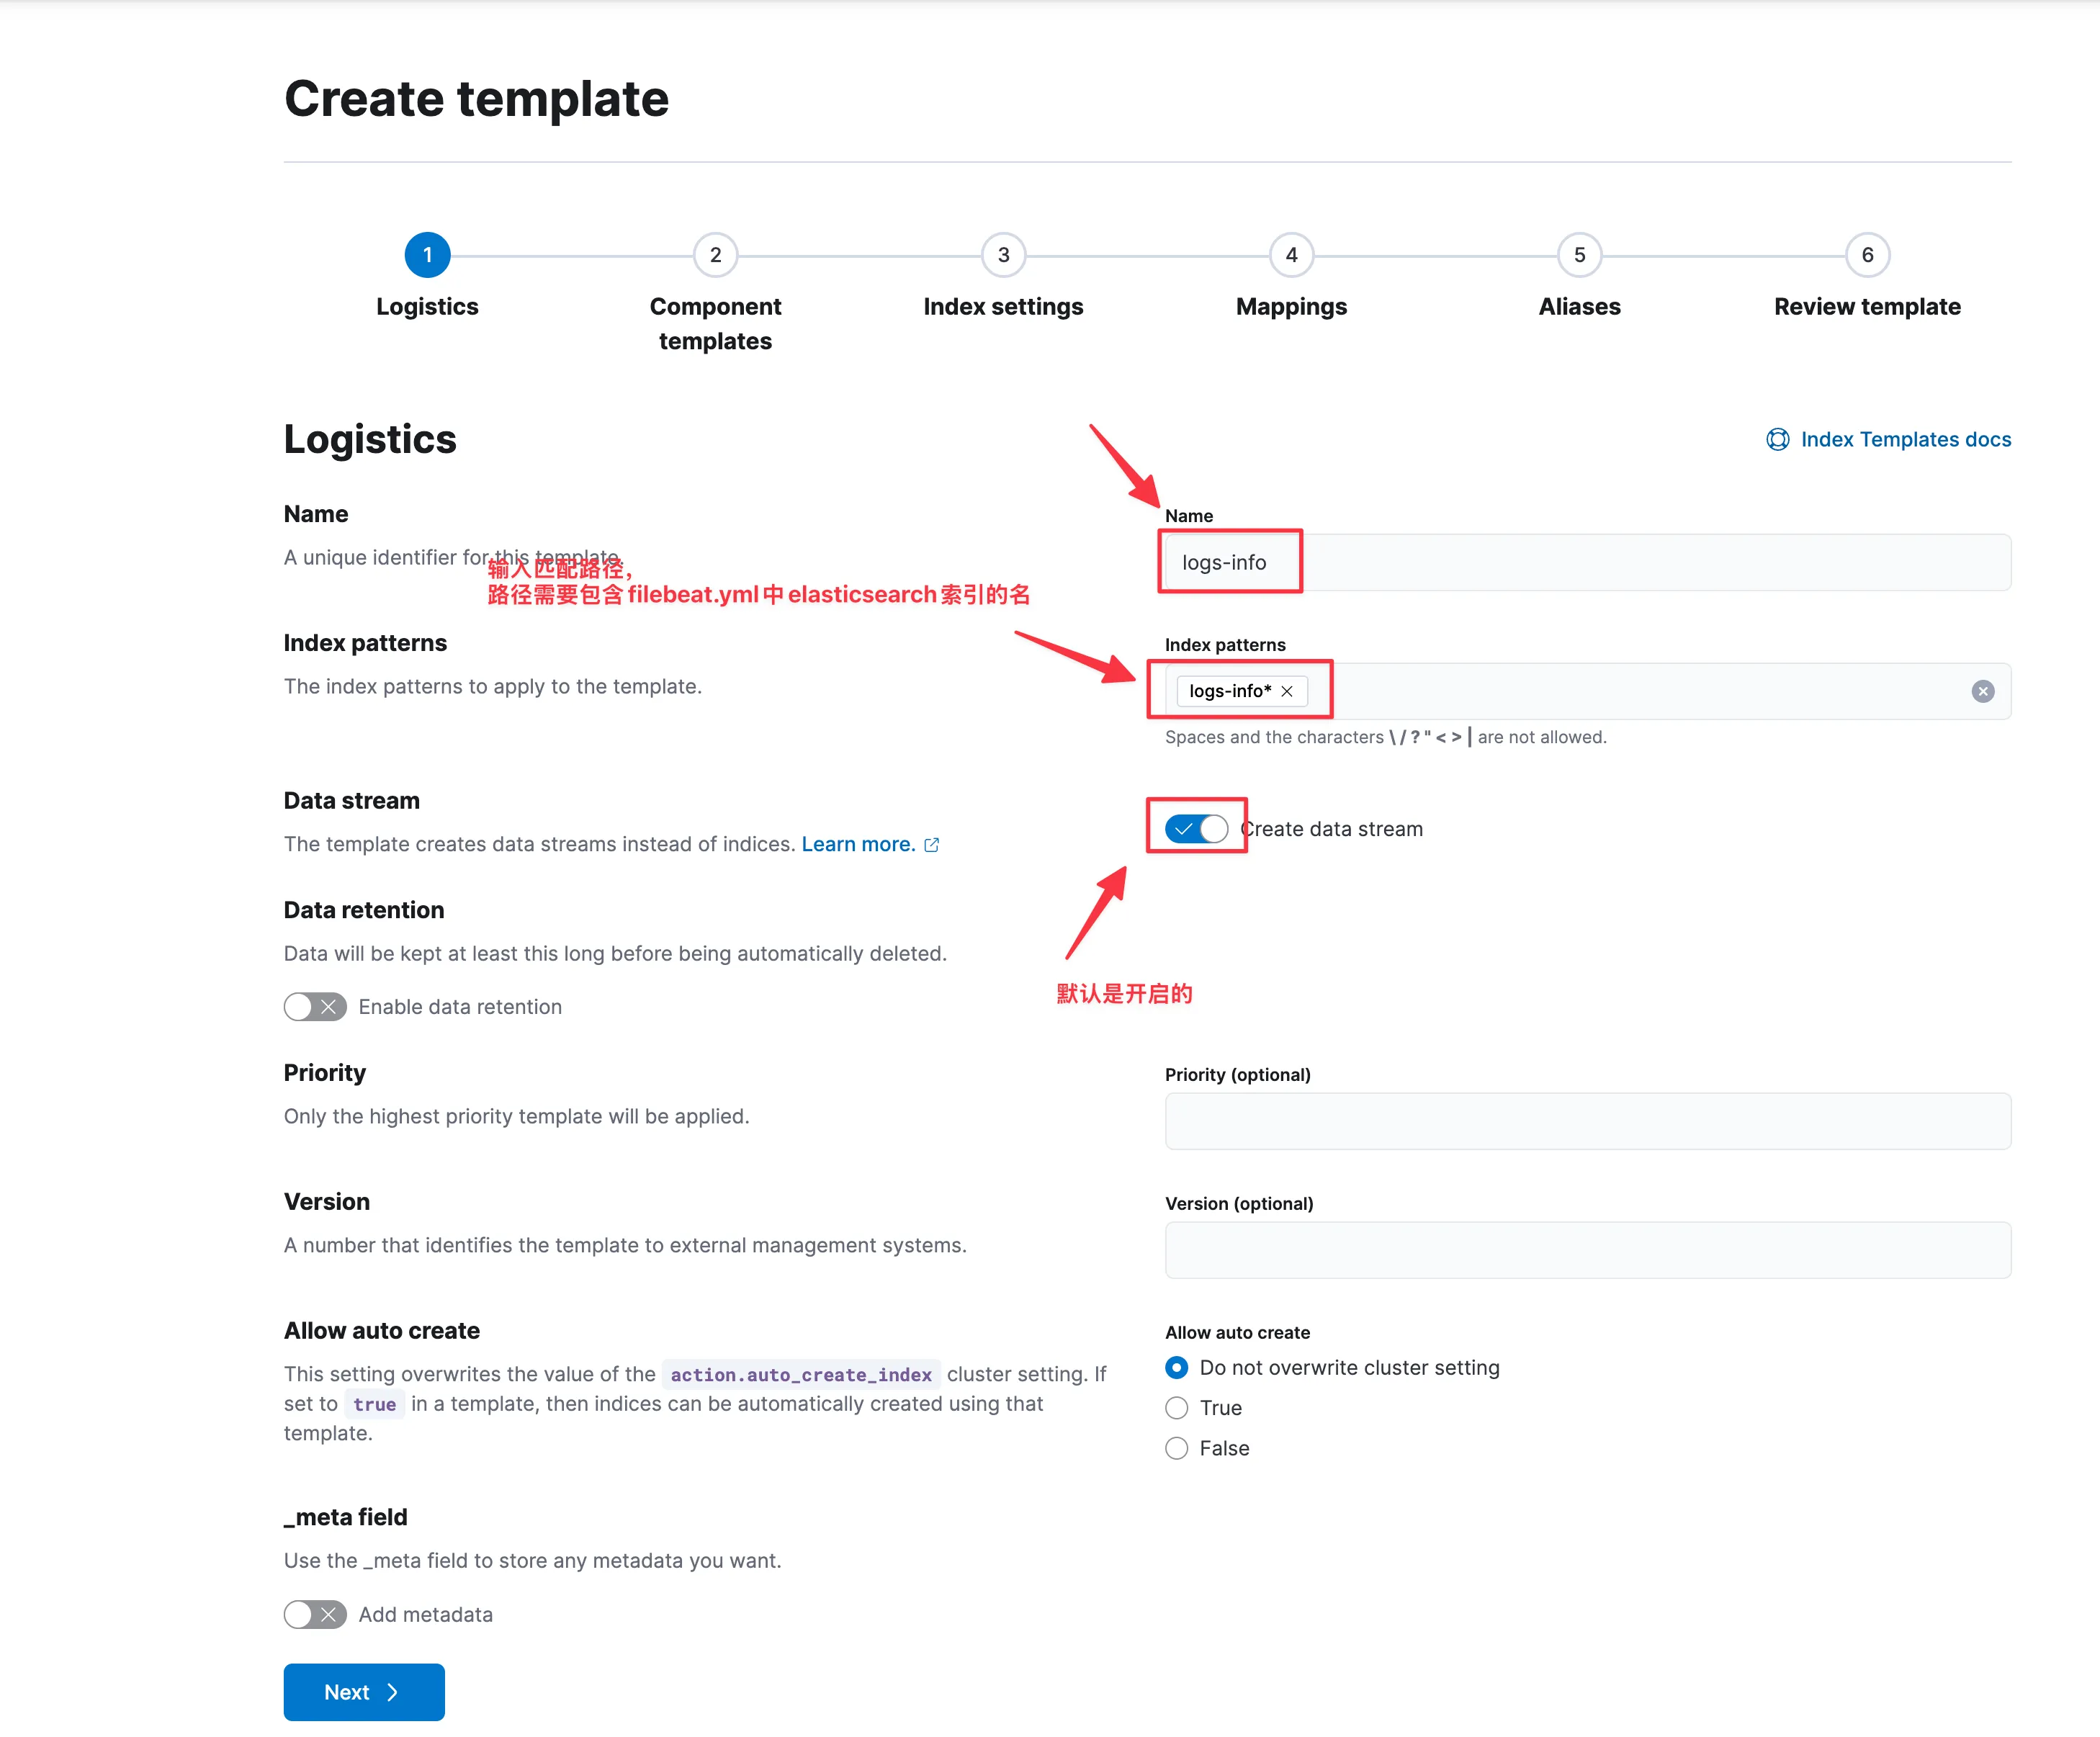
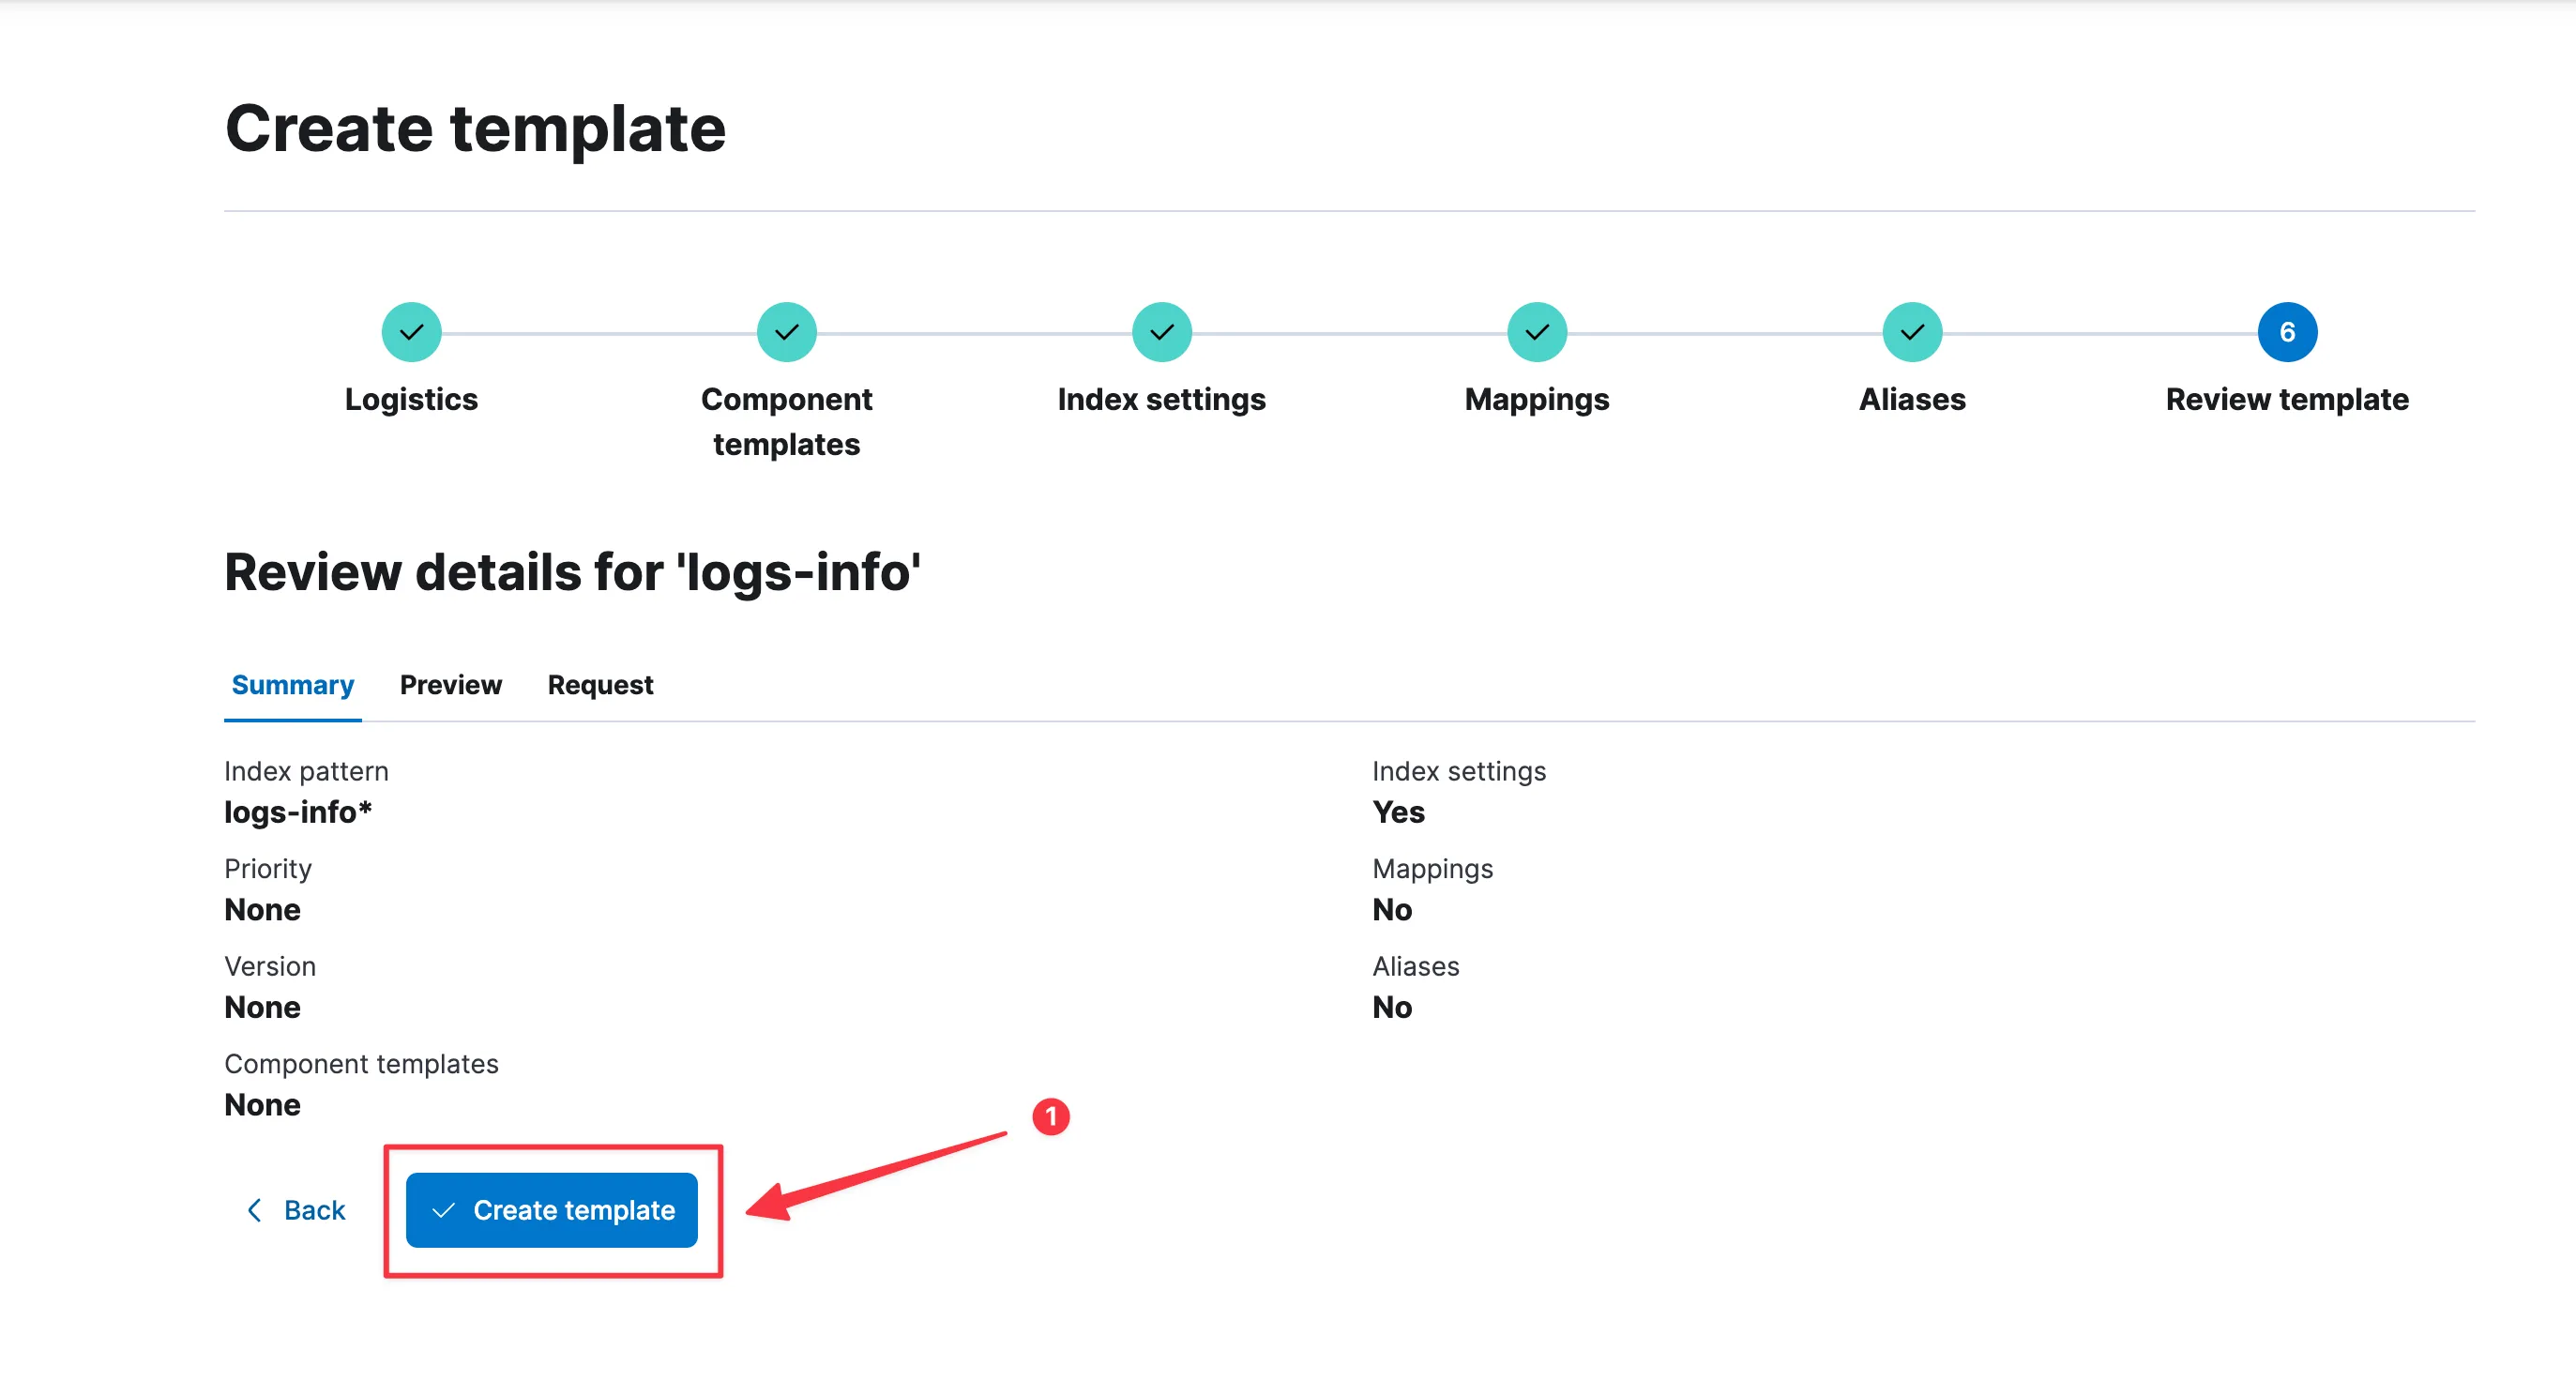
需要注意,我创建的是logs-info索引模版,可能会与filebeat自带的logs冲突,此时需要配置我们自己创建logs-info的索引模版优先级即可。
即Index Templates中的第一步截图,有个Priority (optional),值越大则优先考虑。
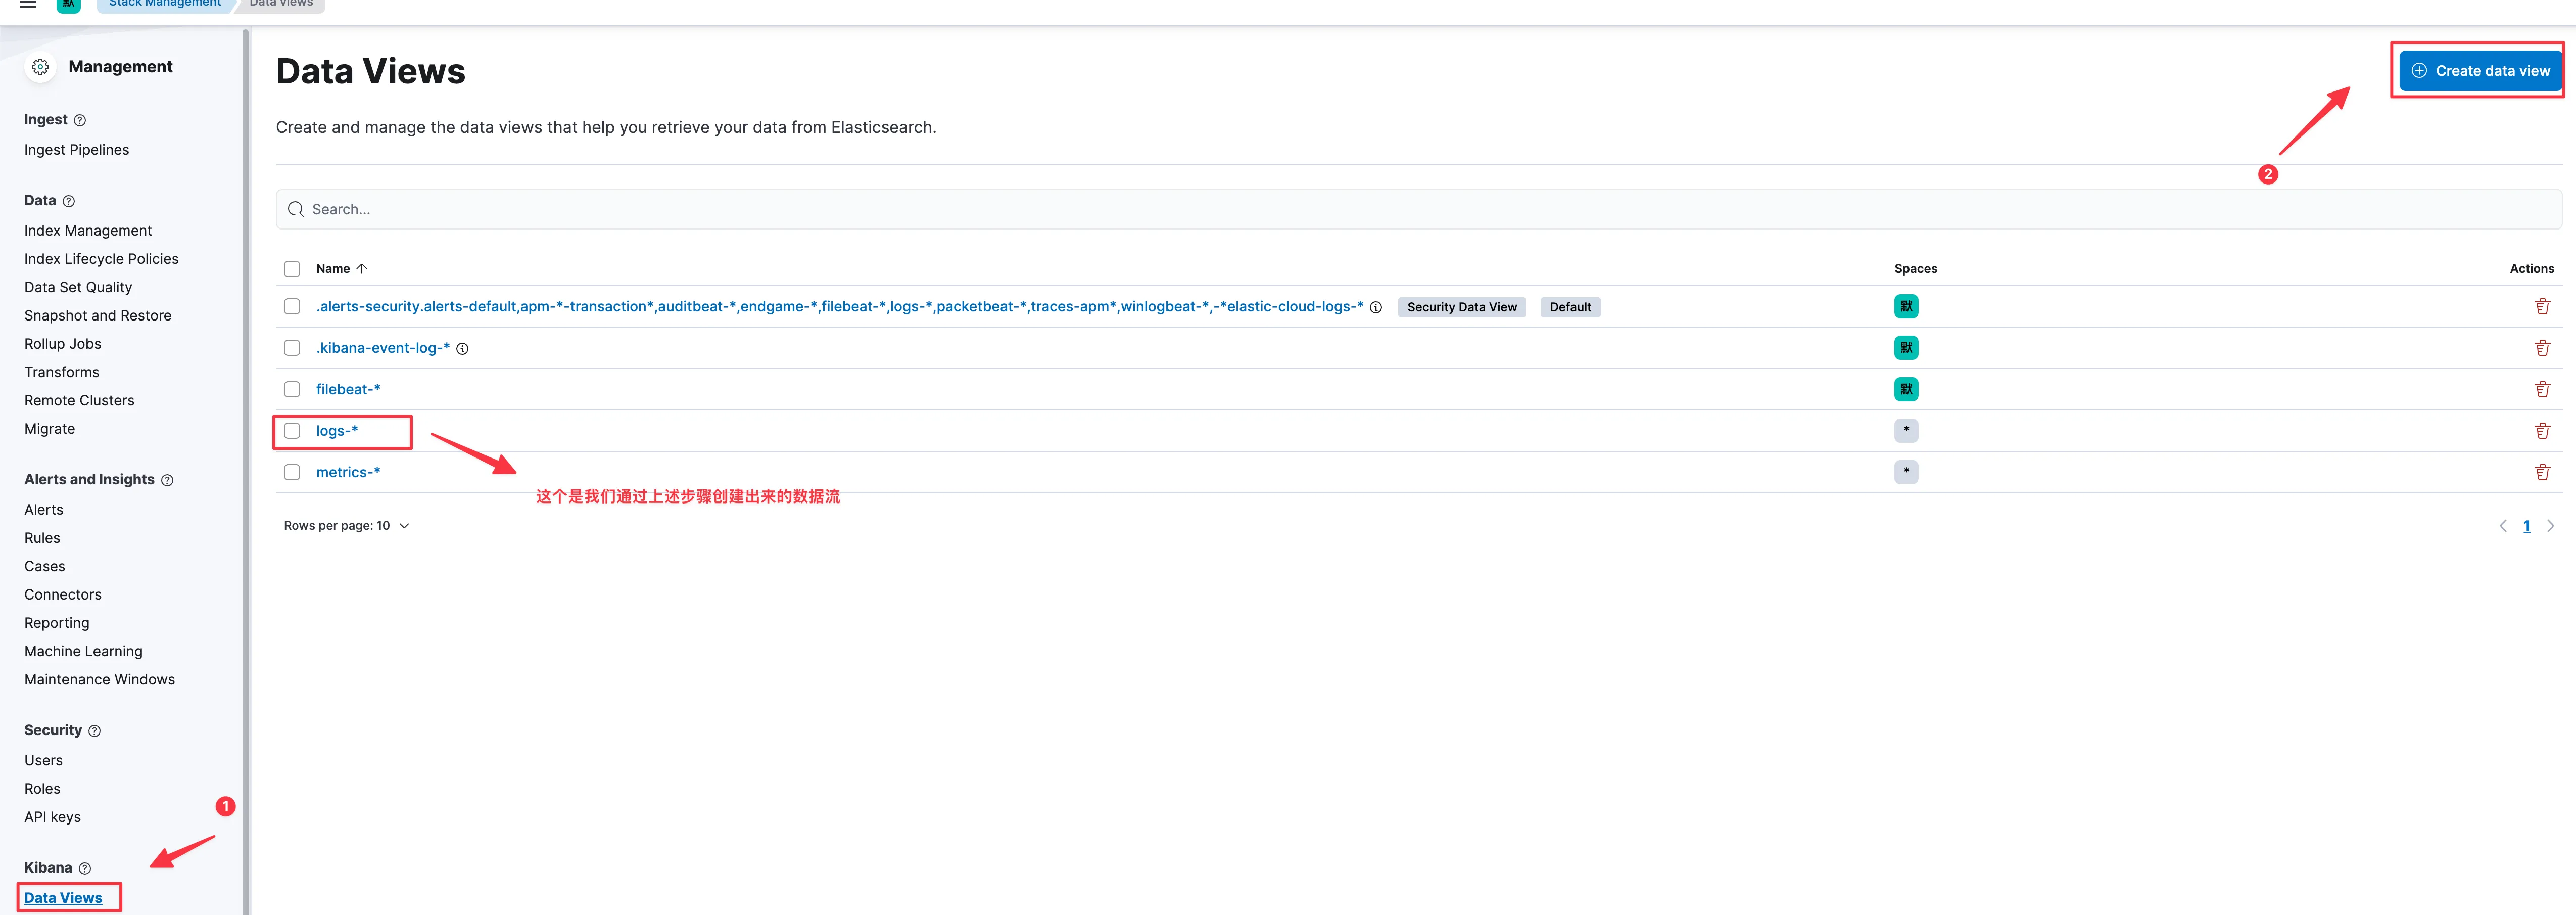
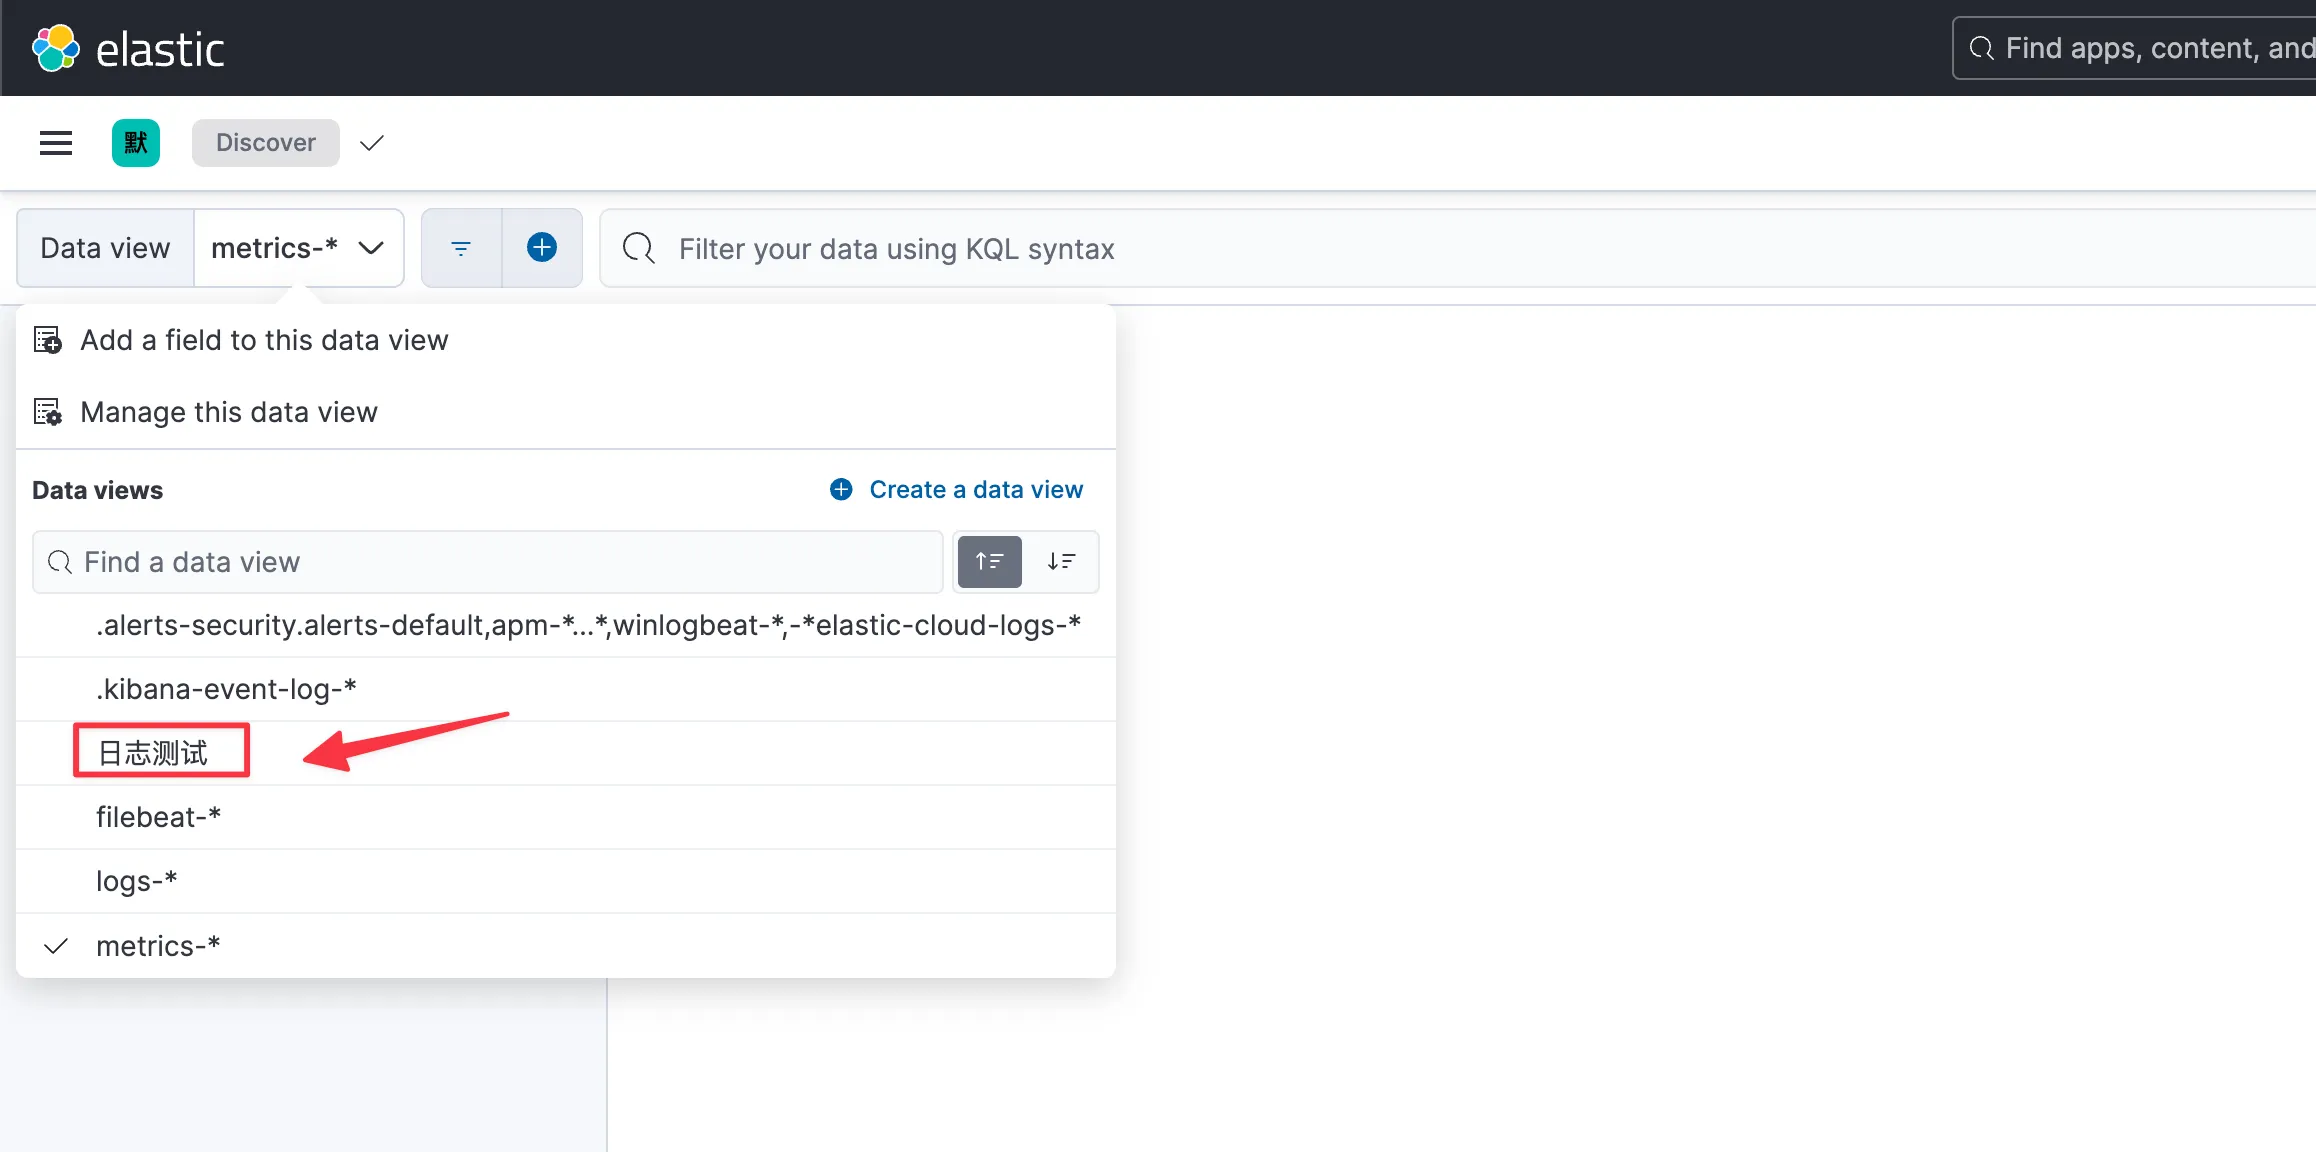
在Stack Management -> Kibana -> Data Views中,创建一个数据模版。后续可以在菜单中的Analytics -> Discover中查看。
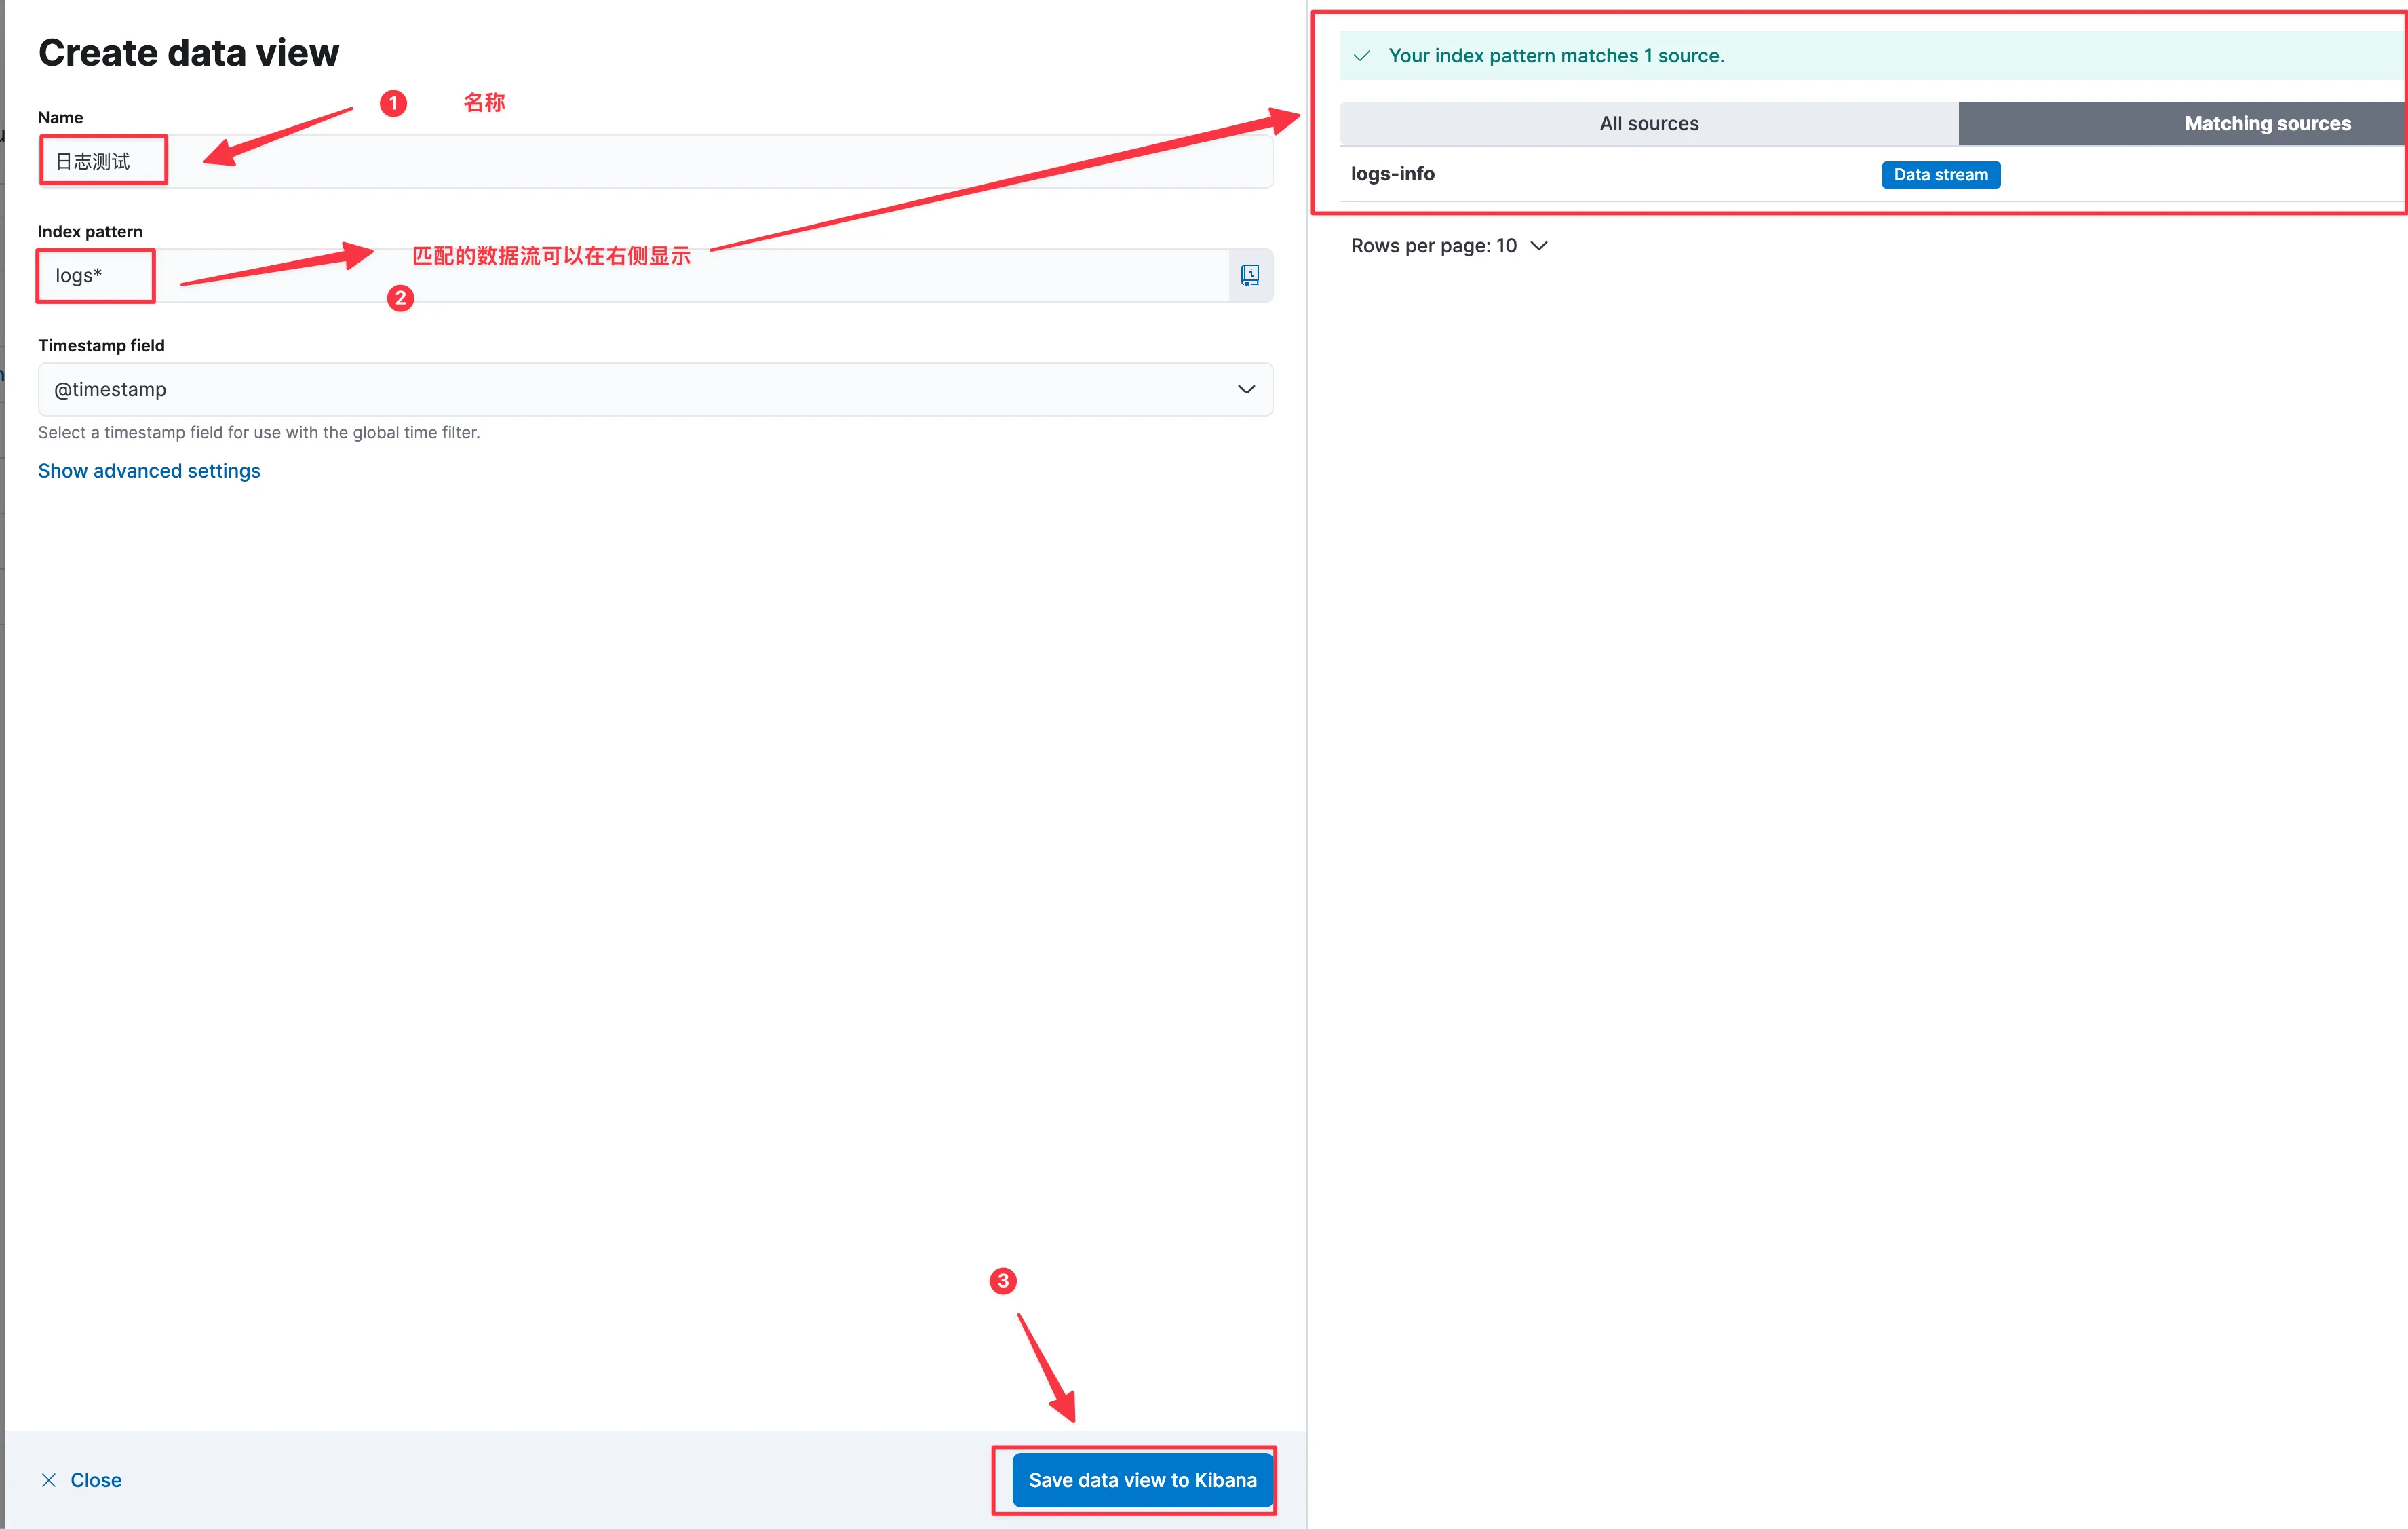
看到如下截图,说明我们配置filebeat采集数据发送给es,在es进行相关配置,则可以轻松方便查看程序输出的日志信息
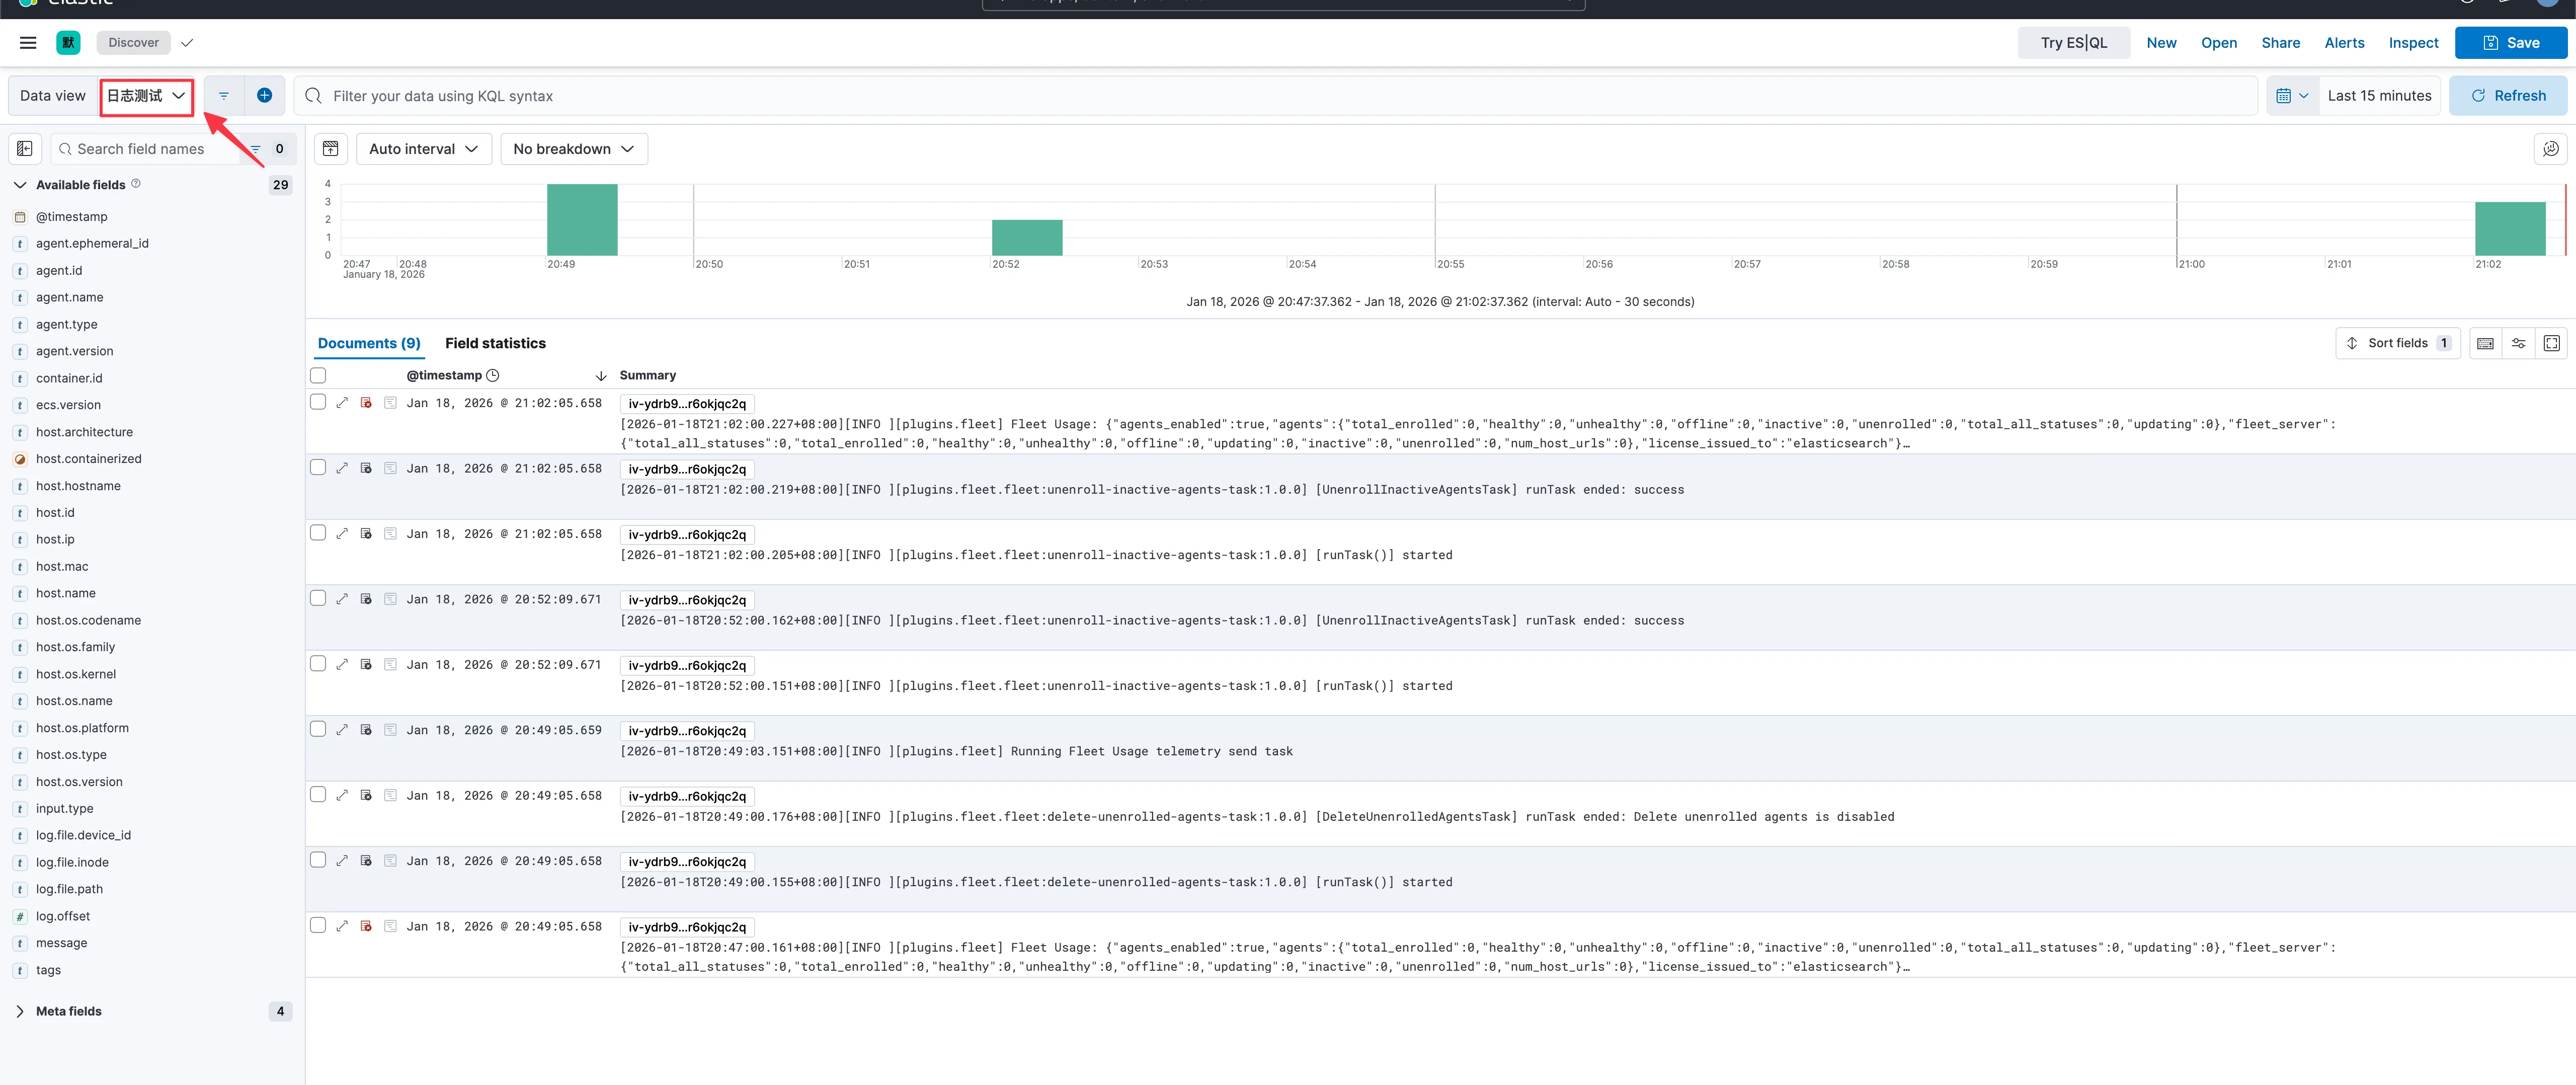
大工告成,到此结束